XAU/USD Recovery Is Underway
- 8 Dec 2020
USD/JPY
USD/JPY candles have narrowed to a doji candle un yesterday’s trading. Another test of the descending trendline may therefore be anticipated. Buyers conviction will be tested as several previous break attempts have failed at this resistance area. Momentum indicators have flattened in bearish territory.

GBP/USD
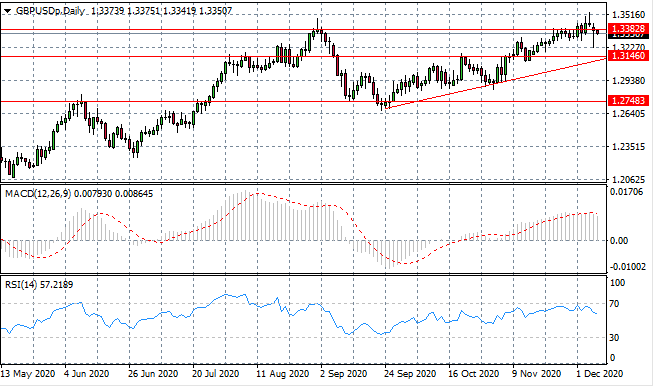
The GBP/USD pair is experiencing considerable volatility at the 1.338 price level, where there is a real tussle between buyers and sellers. The next few trading will define whether the recent rally has come to an end or whether the current move is merely a pullback. Momentum indicators are bullish with RSI pulling away from overbought conditions.
EURUSD
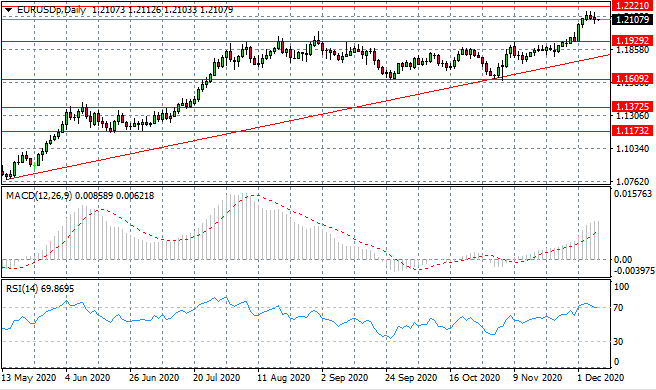
The Eurodollar has stalled with a series of small-bodied candles indicating that we may be on the verge of a reversal. The question is whether sellers have the appetite to drive a change in price direction. The 1.192 will once again become a target if buyers concede. A momentum reversal appears to be underway, with RSI turning back towards the 70 resistance line.
USDCHF
A price reversal appears imminent in the USDCHF pair. The pattern of candlesticks, which has seen price action stall at the 0.889 support level, indicate that the price may reverse. An morning star doji pattern appears to be in the making and the current trading session will be a confirmation. Momentum indicators are bearish with RSI testing oversold conditions.

XAUUSD
XAUUSD has climbed back to the 1860.18 price level which represents the floor of a previous trading range/ consolidation channel. A break would clearly signal the intentions of buyers and we may then see another test of the descending trendline. Momentum indicators have sharp upward trajectories.

US500
The US500 continues to test the 3670.04 resistance level. Despite price action moving beyond the resistance area a full break is yet to materialise. Buyers’ conviction will be tested. Overall, the longer-term trajectory for price action is bullish. Momentum indicators have flattened in bullish territory with RSI bouncing along the oversold line.

