Commodities Suffer At End Of Trading Week
- 3 May 2019
Be The 1st To Redeem $50 Cash Rebates! Limited-time offer! Get it now!
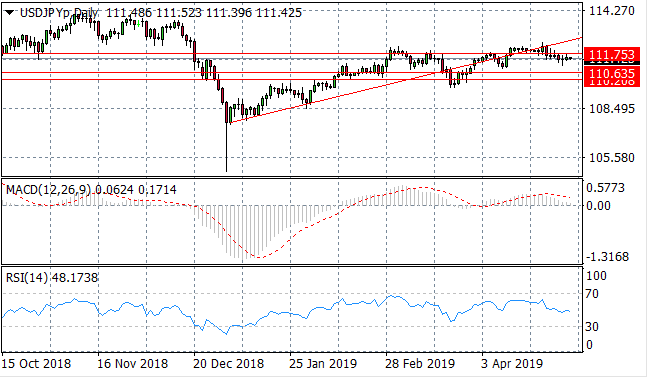
USD/JPY
The USD/JPY pair has fallen below the 111.75 price level after a strong sell-off at the end of last week. Buyers appear to have returned to some degree however, but small-bodied candles indicate little conviction. MACD has a downward trajectory yet RSI is neutral/bearish.
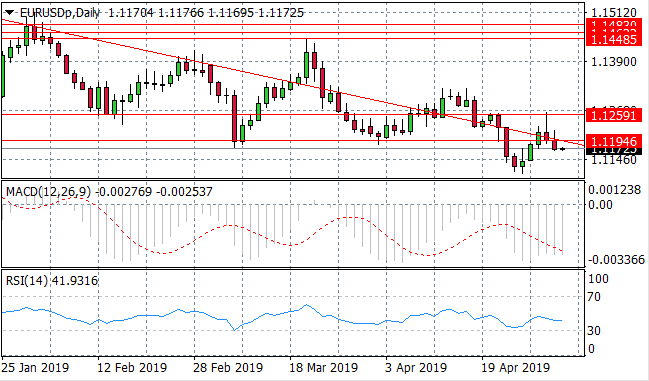
EUR/USD
The EUR/USD pair has broken the 1.119 support level with rising selling pressure taking the pair below the descending trendline at the same time. Momentum indicators have stalled in bearish territory with the pair likely to oscillate around the descending trendline.
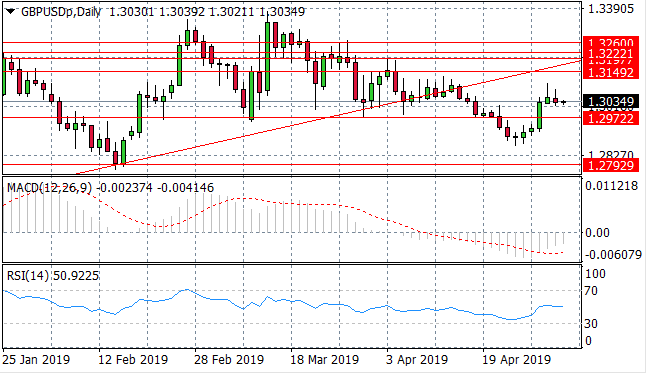
GBP/USD
The GBP/USD pair had begun a sharp rally, with sellers returning to the pair shortly after a break of the 1.297 price level. Momentum indicators have turned sharply bullish with a reversal taking place on MACD, however, RSI has stalled at the default line, in neutral territory.

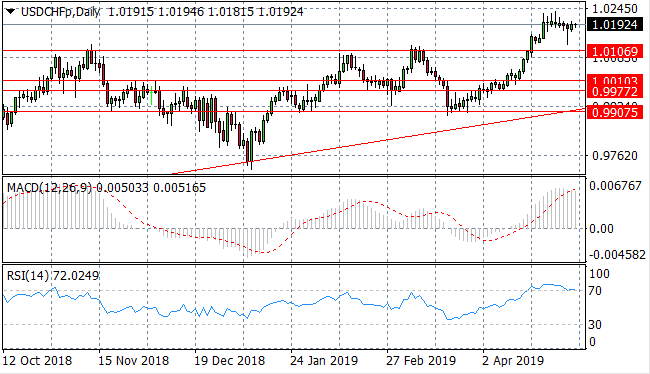
USD/CHF
The USD/CHF pair appears to be on the verge of a reversal. A series of doji candles indicate a break in the current rally, although there is currently not enough conviction from sellers to drive prices lower. Momentum indicators signal a bearish reversal with RSI on the verge of breaking the 70 overbought line to the downside.
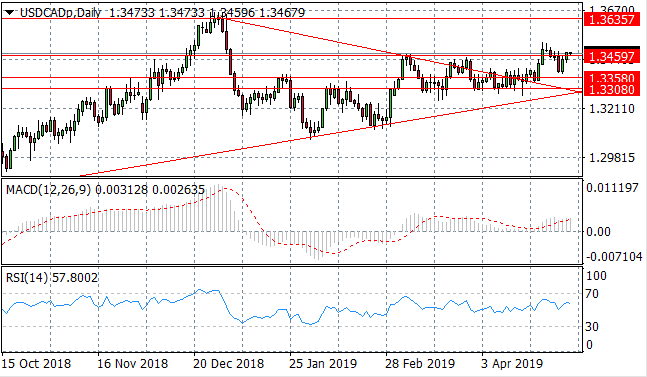
USD/CAD
The USD/CAD pair is returning to a previous trading range between the 1.335 and 1.345 price levels. Buyers appear to have returned to the pair after approaching the 1.335 support area. The pair is yet to break the 1.345 resistance level. Momentum indicators are mixed if slightly bullish.
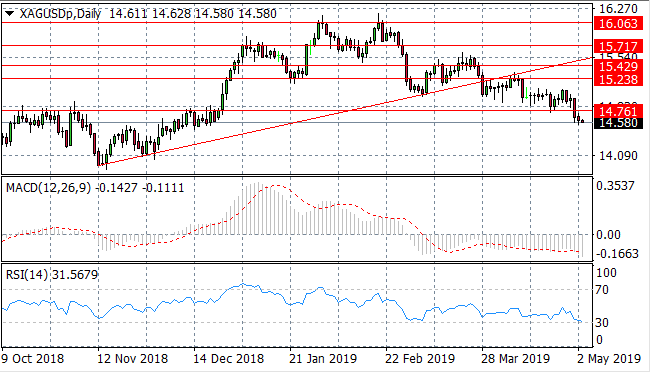
SILVER
Silver has finally broken the 14.76 support line after several previous attempts, which may now indicate longer term bearish sentiment for the metal. Momentum indicators have flattened in bearish territory with RSI approaching the 30 support level.
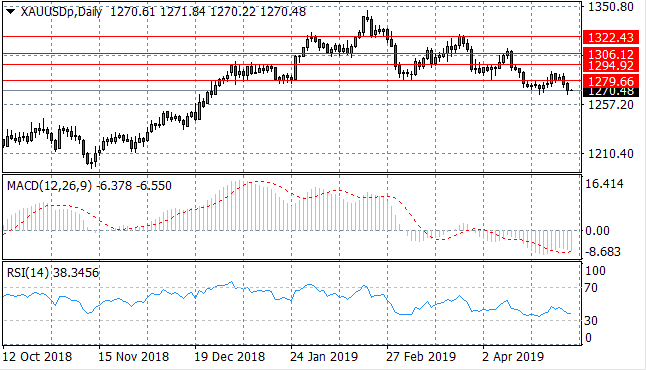
GOLD
Gold has failed to break the 1279.66 price level on several occasions as the price line begins to represent a resistance area. The longer-term trend has been bearish. Momentum indicators remain in bearish territory with RSI approaching the 30 support level.
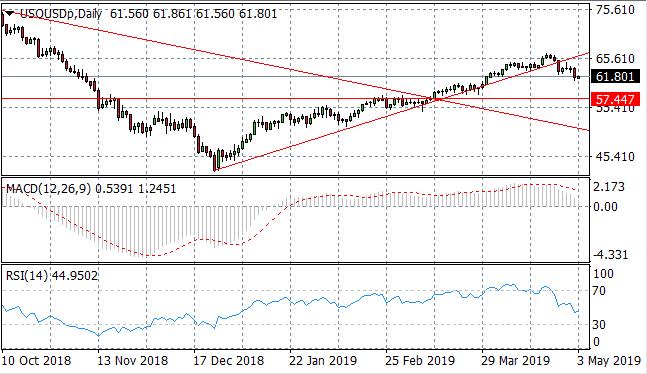
OIL
WTI has pulled back significantly to test the lower range $60 per barrel despite OPEC reducing output. Geopolitical intervention initiated the decline in price and it remains to be seen how far prices will fall. RSI has turned significantly bearish and MACD is approaching the zero line.
Follow Us on Facebook:
