Eurodollar Tests Key Support Area
- 22 Aug 2019
Kickstart your new year with the best USD50 bonus campaign. Limited-time offer! Get it now!
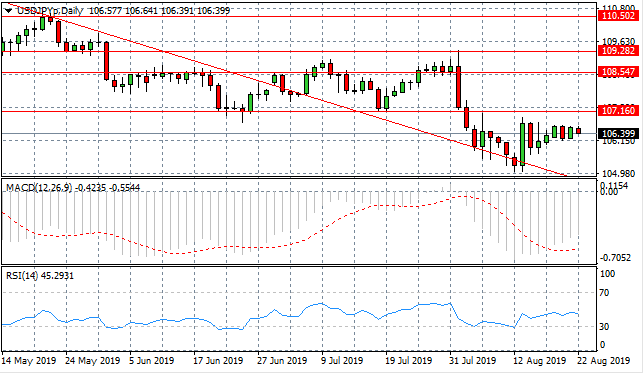
USD/JPY
USD/JPY price action has begun to slow with smaller-bodied candlesticks indicating uncertainty from market participants. A breakout seems the most likely outcome from the slowdown. The next target is the 107.16 price level which has been a key support level in the past. Momentum indicators have moderate upward trajectories.
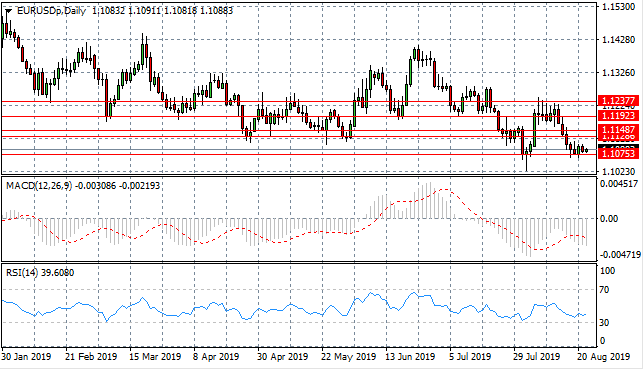
EUR/USD
The Euro has rebounded from the 1.107 price line which retains its position as a key support level, despite the bearish sentiment. Smaller-bodied candles represent indecision in the pair, with both sellers and buyers lacking the conviction to influence price action in a meaningful direction. Momentum indicators remain bearish.
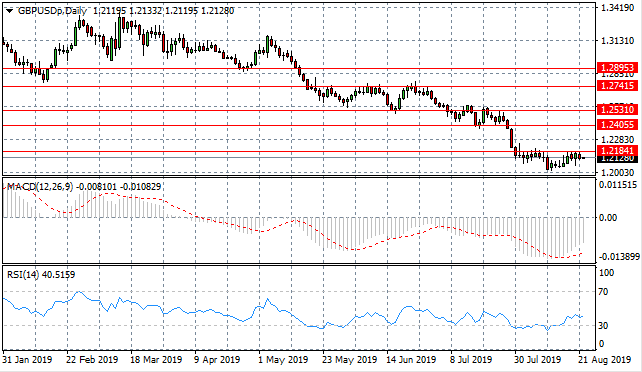
GBP/USD
The GBP/USD pair continues to test the 1.218 resistance line and despite buying pressure, a break is yet to materialize. A reversal of sorts is underway yet the recovery may be the result of a lack of U.S. Dollar buyers than renewed appetite from Pound buyers. Momentum indicators have turned bullish.

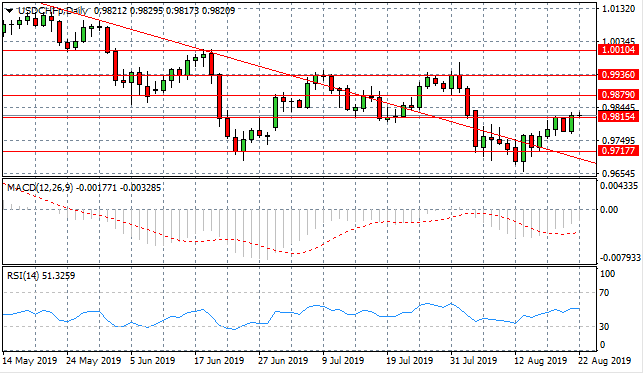
USD/CHF
The USD/CHF pair continues to test the 0.981 resistance line yet buyers have been unable to clear the hurdle. A break may confirm the end of a long-term downtrend, as the pair moves into a new trading range. Momentum indicators are neutral if slightly bearish.
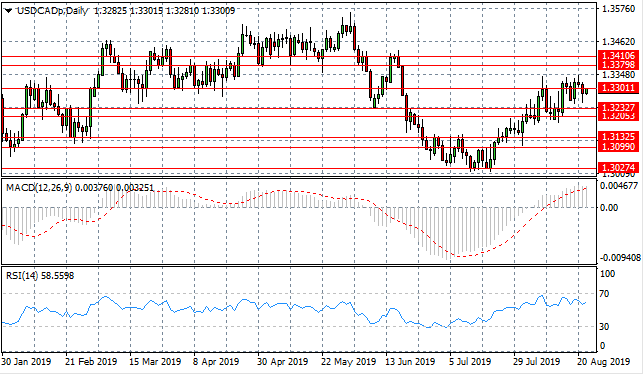
USD/CAD
The USD/CAD pair continues to test the 1.330 resistance level and each time there is a break, selling pressure rises. The resistance line remains a sticking point for price action perhaps signifying the end of an extended rally. Momentum indicators are bullish, however, RSI is yet to reach overbought conditions.
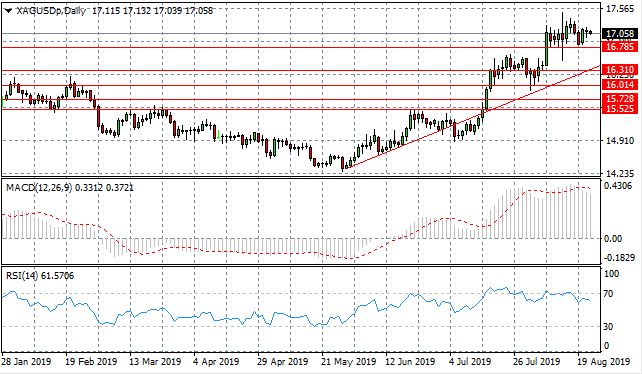
SILVER
Silver has once again rebounded from the 16.78 support line with bullish price action, which has then been followed with a series of doji candles. Fundamental factors will likely be required for a breakout in either direction. Momentum indicators are also pulling back from overbought positions.
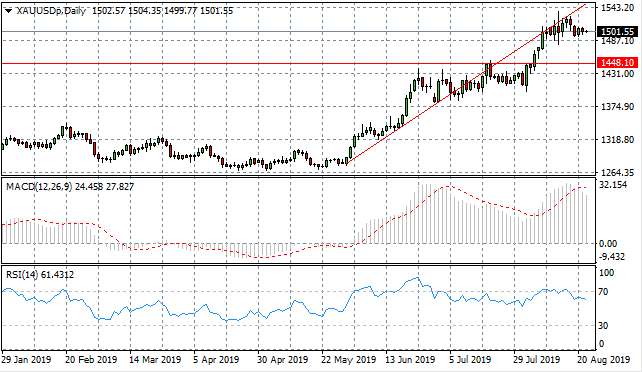
GOLD
Gold has pulled away from the ascending trendline, with rising bearish sentiment not seen since the beginning of July. A support level exists at the 1448.10 price line. Momentum indicators are also pulling back from strongly bullish positions and RSI has broken the 70 resistance line.
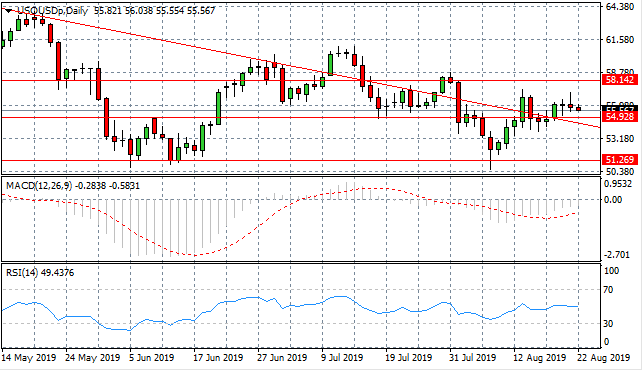
OIL
WTI has broken both the descending trendline and the 54.92 support level with a strong bullish move. However, the break has resulted in a series of doji candles with some selling pressure, representing indecision in trading activity. Momentum indicators are neutral if slightly bearish.
Follow Us on Facebook:
