GBP/USD Suffers Another Sell-Off
- 11 Dec 2018
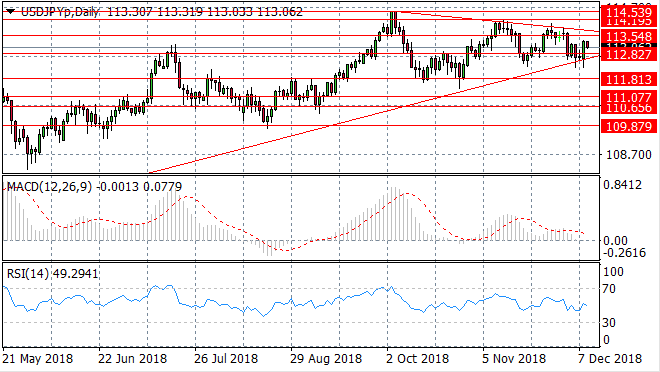
USD/JPY
The USD/JPY pair has entered into a symmetrical triangle pattern and despite tests of the lower trendline, the pattern remains intact. The pair is yet to reach the apex of the triangle at which point a breakout is expected. Momentum indicators have turned bearish with MACD approaching the zero line.
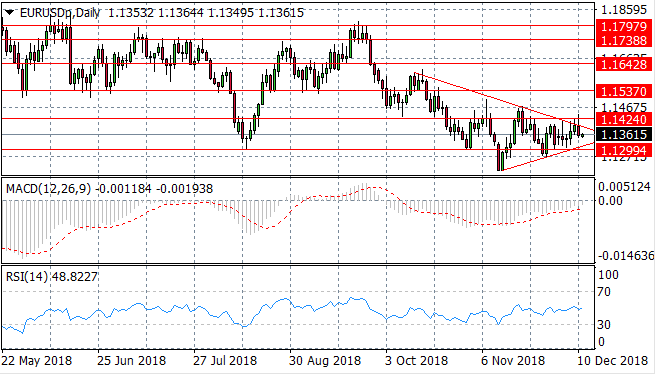
EUR/USD
The EUR/USD pair has also developed into a sharp symmetrical triangle pattern and has tested the upper trendline, confirming continuation of the bullish momentum. A bullish breakout seems likely. MACD is approaching the zero line and RSI has an upward trajectory.
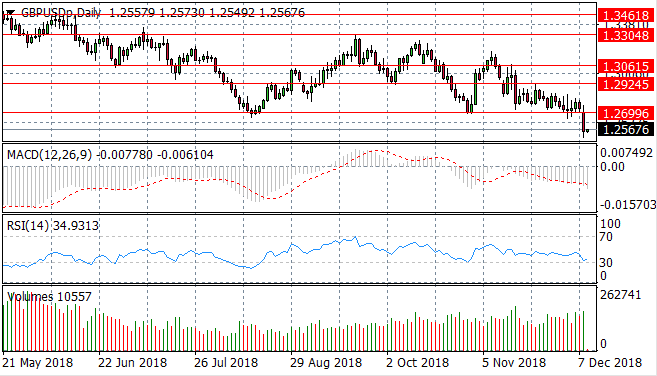
GBP/USD
Fundamental factors influenced the recent sell-off in the GBP/USD pair and these factors continue to put pressure on the Pound, as the pair breaks a recent floor at the 1.269 price level. Momentum indicators are moderately bearish with MACD remaining below the zero line and RSI bouncing along the 30 level.
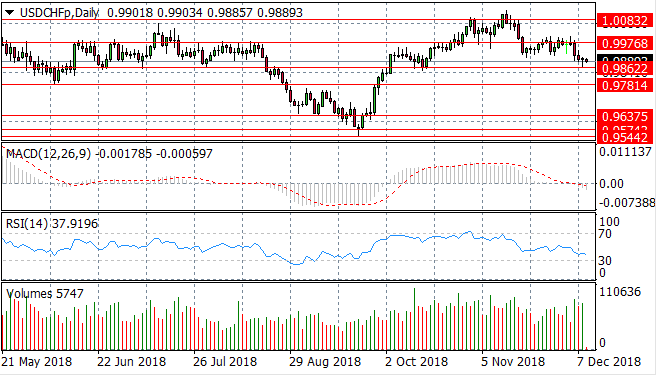
USD/CHF
The 0.997 price level has suffered a break with the USD/CHF pair heading towards the 0.986 price level which represents a previous resistance area. Volume has climbed into the bearish move, indicating strong conviction from sellers. MACD has broken the zero line and RSI is approaching the 30 support level.
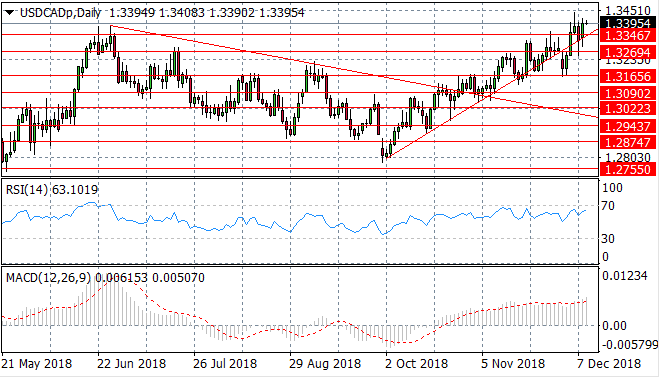
USD/CAD
The USD/CAD pair has broken the ascending trendline and the 1.334 price level which represents a previous price high. Buyers remain motivated for the time being as price action continues to climb. Momentum indicators are bullish with MACD extending its position into bullish territory and RSI approaching overbought conditions.
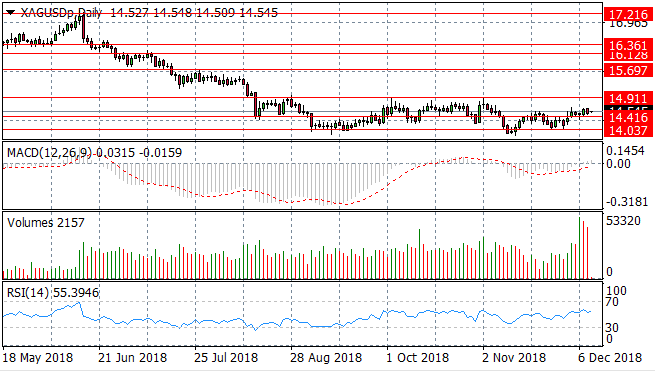
SILVER
Silver has rebounded from the 14.03 price level to maintain a recent trading range between the 14.03 and 14.91 price levels. Buyers have returned to the metal to break the 14.41 price level. Momentum indicators have turned bullish with MACD breaking the zero line and volume has climbed into the move.
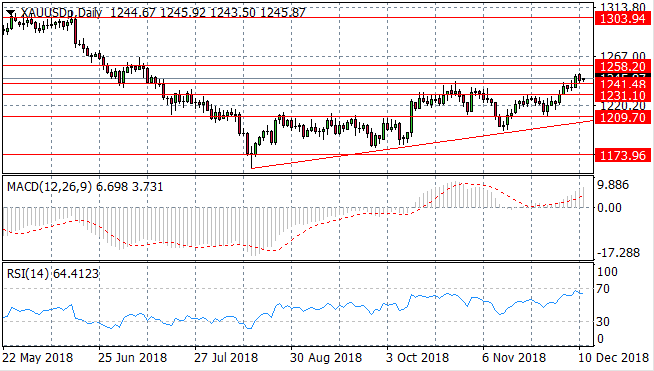
GOLD
Gold has broken the 1241.48 price level and the next resistance area for the metal is the 1258.20 price level. Sellers have returned since the break which has seen a slowdown in the rally. Momentum indicators have turned sharply bullish, however RSI has pulled back from the 70 resistance area.
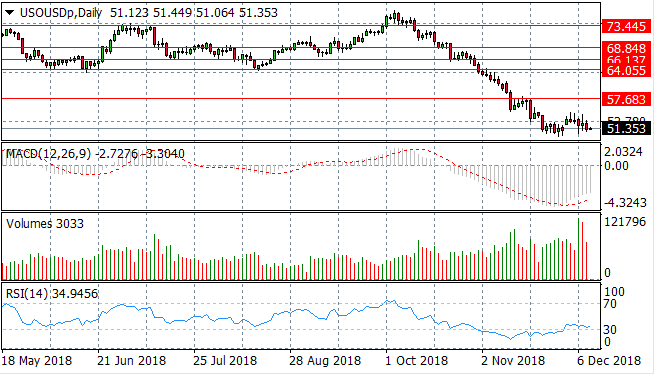
OIL
Oil has made a mild recovery after an extended sell-off and now appears to be consolidating. However, sellers are still very much active as witnessed by the sharp rise in volume. Momentum indicators are moderately bullish; MACD appears to be undergoing a momentum reversal and RSI has broken the 30 support level.