GBPUSD Finds Support; Reaches New Highs
- 4 Jan 2021
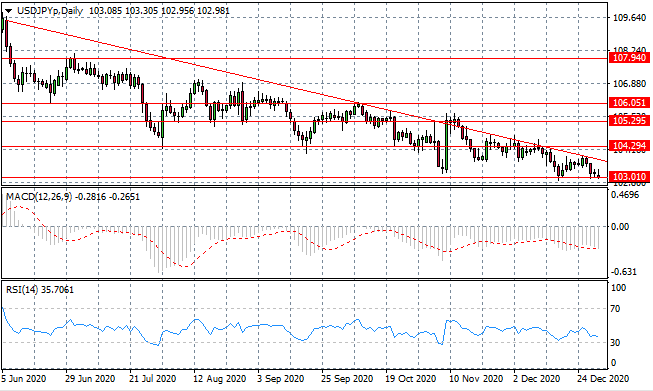
USD/JPY
The USD/JPY pair has continued its downward trajectory towards the 103.01 support level where previous rebounds have taken place. Price action continues to track the descending trendline which is acting as a resistance level. If price action can break this support level, volatility will be triggered. Momentum indicators have flattened in bearish territory.
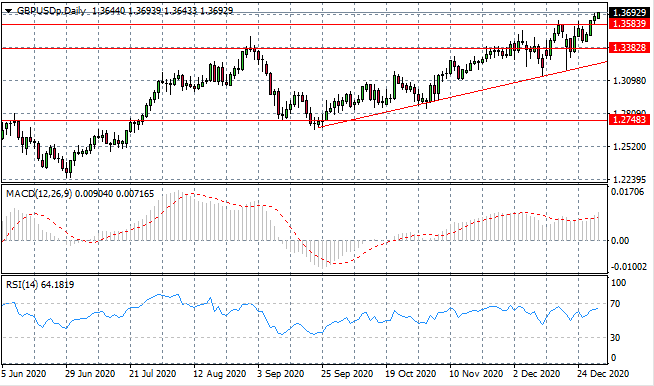
GBP/USD
The GBP/USD pair has broken a recent price high at the 1.358 resistance level, with price action continuing on to new highs. Much of the recent moves have been due to optimism related to news. Whether the optimism is warranted, given macroeconomic data, remains to be seen and will be determined in the first quarter. Momentum indicators are bullish.
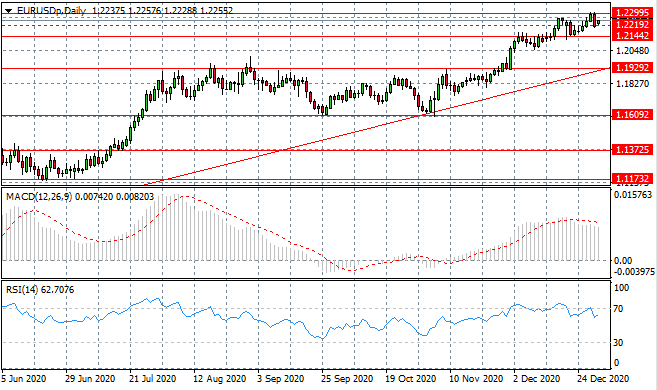
EURUSD
The Eurodollar has rebounded from the 1.229 resistance level, yet overall, the trend remains bullish, indicating that the recent bearish move may represent a pullback. A trading range between the 1.214 and 1.229 price levels has been established. Momentum indicators remain in bullish territory, yet RSI is pulling away from the 70 resistance line.
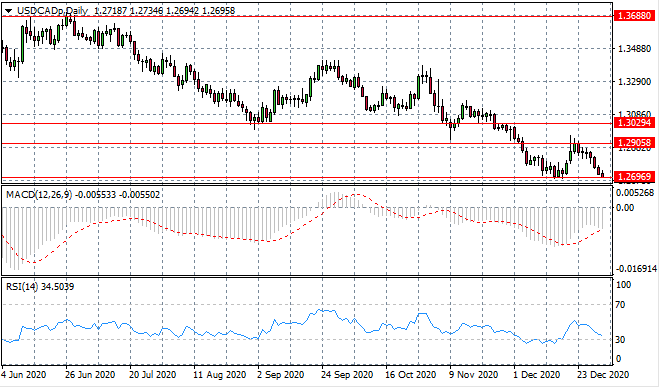
USDCAD
The USDCAD pair has pulled back towards the 1.269 support level, where previously a bullish rebound took place. Overall, despite a few rally attempts, price action has been bearish since the end of October. Further, the last four trading sessions have been bearish for the pair, indicating strong conviction from sellers. Momentum indicators are bearish with RSI heading towards oversold conditions.
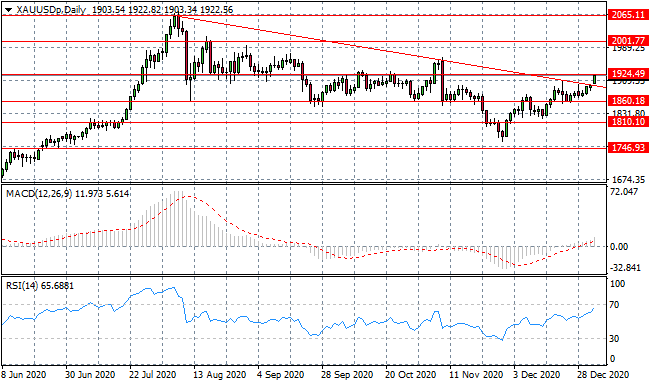
XAUUSD
XAUUSD has broken above the descending trendline and has moved into the 1900 range. The recent rally indicates that bullish momentum is beginning to rise. A break of the 1924 price level would see the metal returning to a previous trading range. Momentum indicators have sharp upward trajectories with RSI approaching overbought conditions.
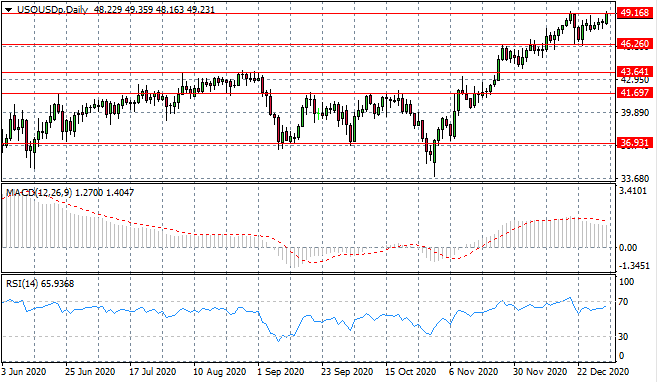
USOUSD
The oil rally has stalled at the 49.16 price ceiling, with price action being contained within the 46.26 and 49.16 price levels. Buyers’ conviction remains as highlighted by another test of the upper range. Despite the slowdown, a longer-term uptrend is well-established. Momentum indicators have flattened in bullish territory.
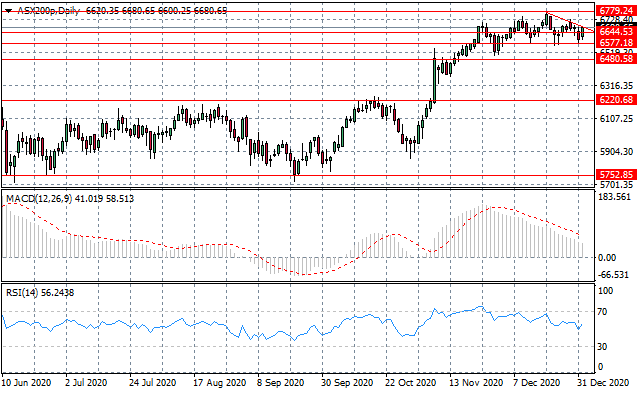
ASX200
The ASX200 is taking on a bearish trajectory after testing a recent price high at the 6779.24 price line. Whether the move is a pullback or the beginning of a downtrend will be determined in the next few trading sessions. A previous test of the descending trendline resulted in bearish moves. Momentum indicators have downward trajectories.