HK50 Is Approaching A Key Resistance Zone
- 8 Oct 2021
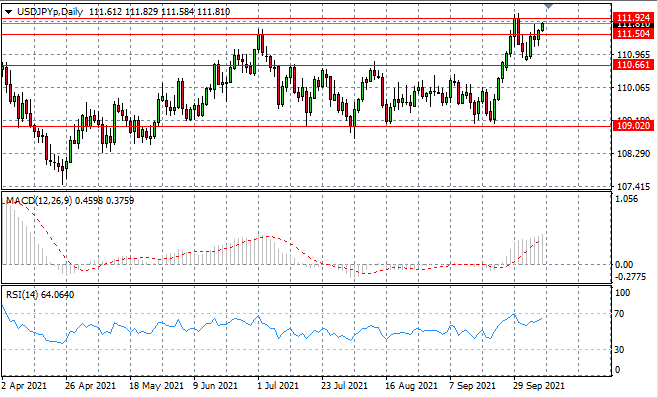
USD/JPY
The USDJPY pair has begun to move towards a price ceiling at the 111.92 resistance line after a break of the 111.50 resistance line. Bullish conviction appears to be present, however, the question is whether buyers have the appetite to drive new price highs.
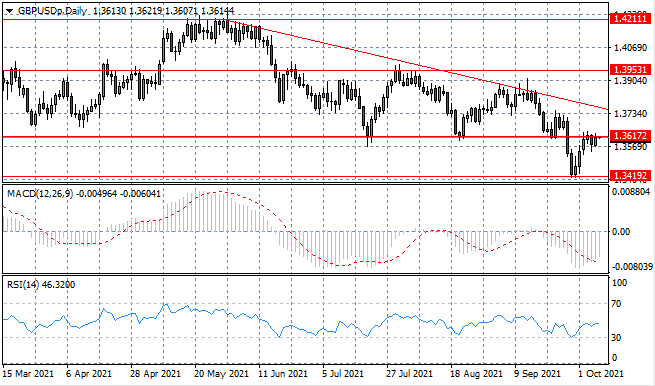
GBP/USD
The GBPUSD pair is making another attempt at the 1.361 resistance line which represents a previous support level for the pair. The number of times the resistance line has been tested and the lack of true conviction from sellers, may signal that a break is imminent. A longer-term bearish bias remains.
EURUSD
The Eurodollar has stalled at the 1.154 price level as price action has begun to flatten after an extended sell-off. The pause may be short-lived before further downside beyond this zone of support. The next few trading sessions will determine whether sellers remain active in the pair.

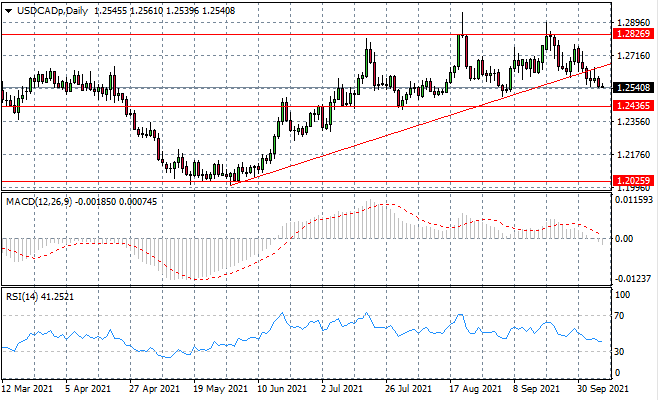
USDCAD
The USDCAD sellers have become more active in driving price action in recent trading and a the break of the trendline remains significant, especially considering how long it has held. Another support line is in sight for sellers at the 1.243 price area.
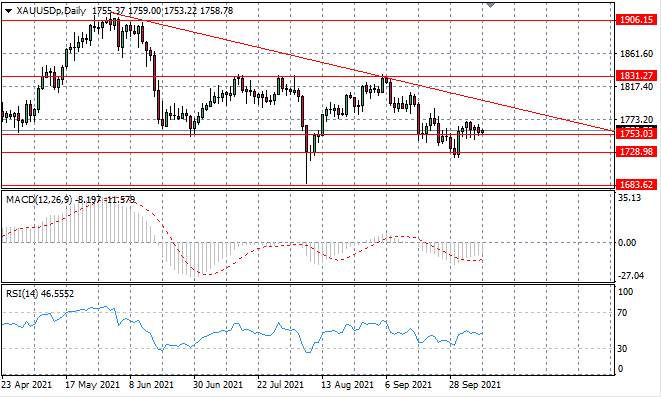
XAUUSD
The XAUUSD continues to test the lower bound of a recent trading range at the 1753 price level. A series of small-bodied candles suggest indecision and a lack of appetite from both buyers and sellers to drive price action. Momentum indicators have also flattened in neutral territory.
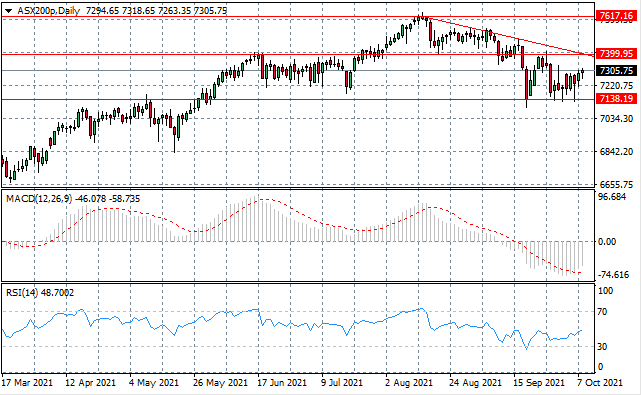
ASX200
The ASX200 has begun to climb back towards a resistance line at the 7399 price level where the descending trendline also intersects the support level. Both have represented obstacles to buyers in the past and have so far, contained price action. Momentum indicators have upward trajectories.
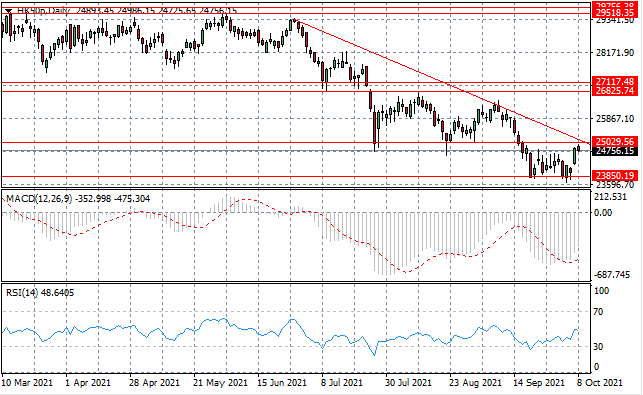
HK50
The HK50 has rebounded from the 23,850 support level as a rally attempt appears to be underway. A key resistance level is approaching at the intersection between the 25,029 resistance line and descending trendline. A break of this resistance area would signal a longer-tern trend change.