No Stopping The US500
- 10 May 2021
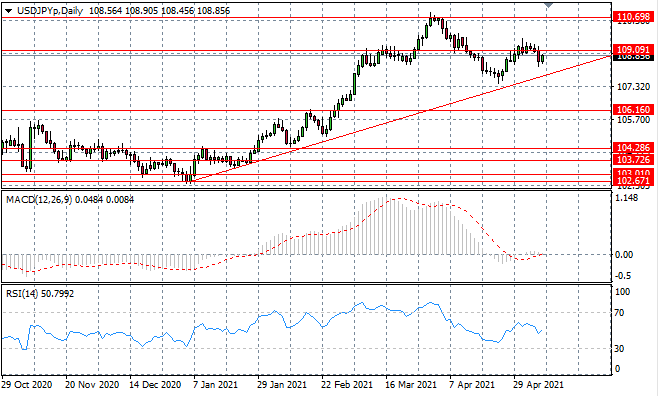
USD/JPY
The USDJPY has pulled back below the 109.09 support level after failing to build any momentum in the rally attempt. The ascending trendline remains a key support level for the pair. Momentum indicators are bullish, with MACD breaking the zero line.
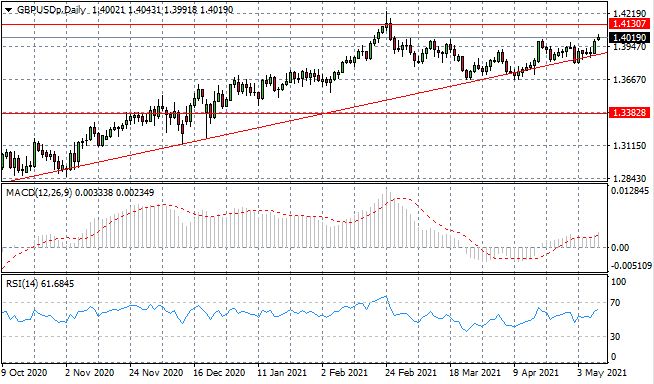
GBP/USD
The GBPUSD pair has once again rebounded from the ascending trendline, as bullish momentum remains. A key resistance area exists at the 1.413 price level where previously, price action failed to clear, resulting in a sell-off. Momentum indicators have upward trajectories.
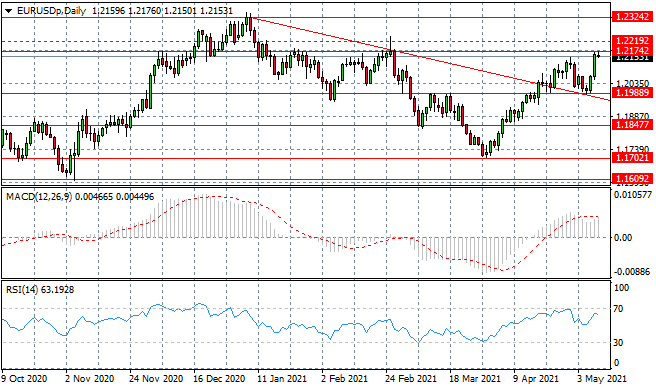
EURUSD
The Eurodollar has found significant support in the latest rally attempt and the result is a test of the 1.217 resistance level, which has previously been an obstacle to any bullish moves. Momentum indicators have flattened in bullish territory, yet there is further upside potential.
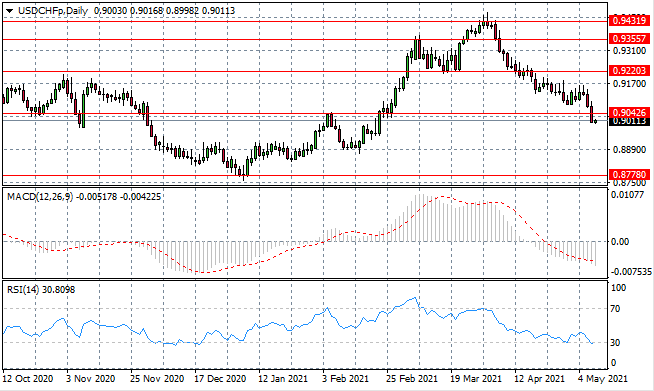
USDCHF
USDCHF has broken the 0.904 support level, with the pair returning to the pre-pandemic trading range. Sellers appear to be active, though until the last two trading sessions, lacked conviction. The next few sessions will test sellers’ resolve. Momentum indicators have flattened in bearish territory, with RSI testing oversold conditions.
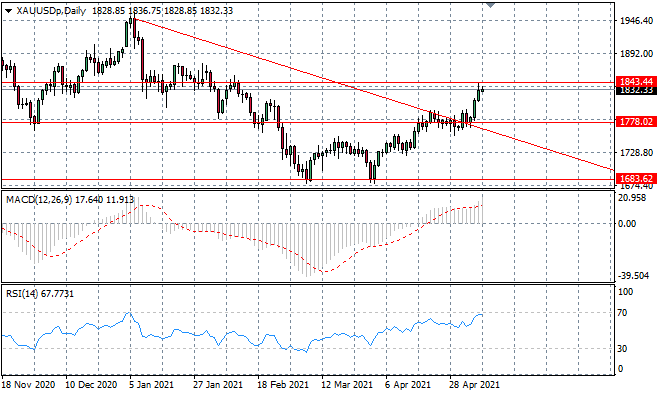
XAUUSD
XAUUSD has broken both the 1778 resistance level and ascending trendline. The conviction shown from buyers to reverse a longer-term bearish bias could facilitate a complete reversal in the trend. Sellers have returned as the metal approaches the 1843 resistance level. Momentum indicators are bullish with RSI testing overbought conditions.
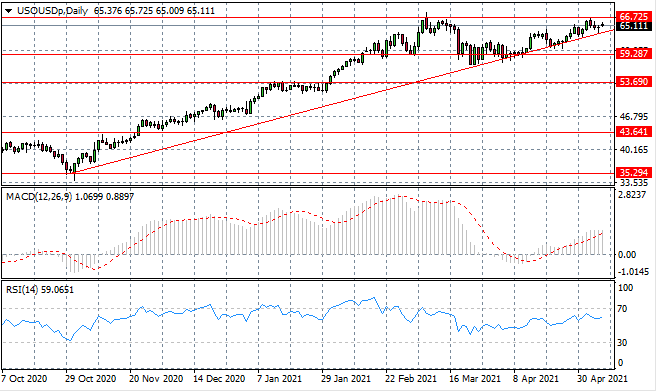
USOUSD
The USOUSD is moving higher and oscillations continue to narrow as the commodity moves closer to the apex of an ascending triangle. A bullish breakout may therefore be anticipated, yet the 66.72 resistance line has been an obstacle in the past. Momentum indicators have flattened in bullish territory.
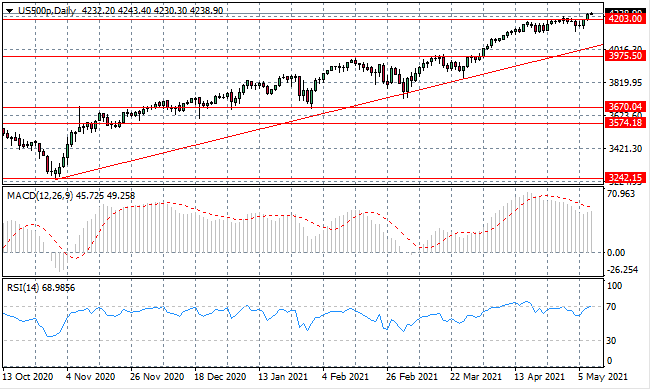
US500
The US500 has broken the 4203 resistance level after several weeks of consolidation at this price line. There is no doubt that the bias is bullish as the pair has been in a extended rally since the end of October. Momentum indicators are bullish with RSI testing the overbought line.
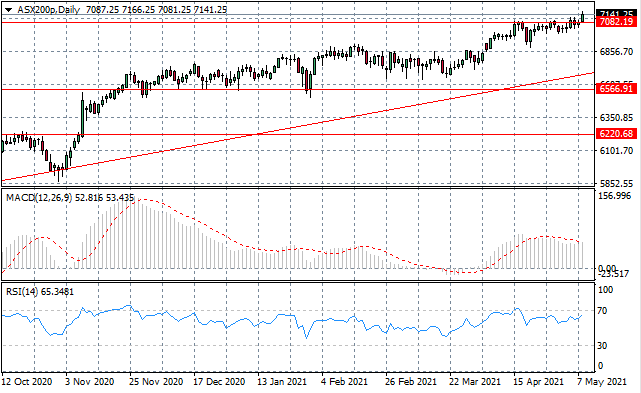
ASX200
The ASX200 has finally broken the 7082 price line after a series of attempts since mid-April. Overall, the trend has been moderately bullish since the end of March. The question is: can buyers sustain the break? Momentum indicators have flattened in bullish territory.