U.S. Dollar Weakens In Mid-Week Trading
- 20 Feb 2019
Kickstart your new year with the best USD50 bonus campaign. Limited-time offer! Get it now!
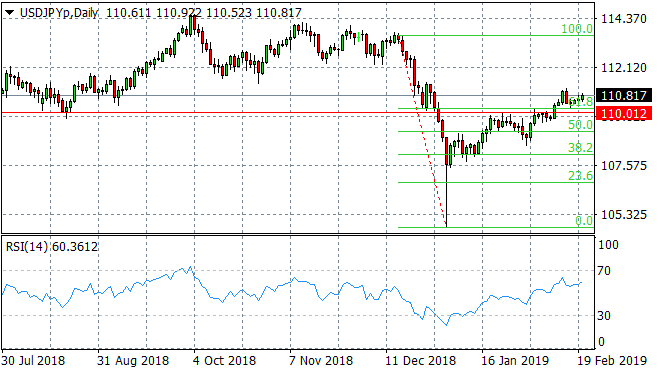
USD/JPY
The USD/JPY pair has stalled just above the 61.8 Fibo level and the 110.01 support level. Given the upward trajectory on RSI it appears there is further upside momentum in the pair. A point to note: RSI is reaching overbought conditions which may mark the end of the rally.
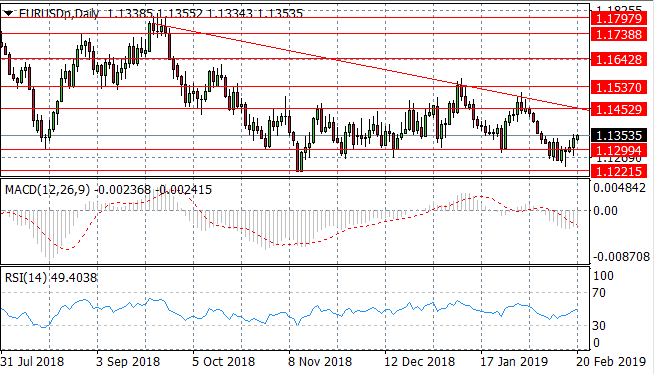
EUR/USD
The EUR/USD pair has broken the 1.129 price level as buying pressure has risen sharply. A trading range between the 1.129 and 1.145 price levels has been established. Momentum indicators are bullish with both MACD and RSI beginning momentum reversals.
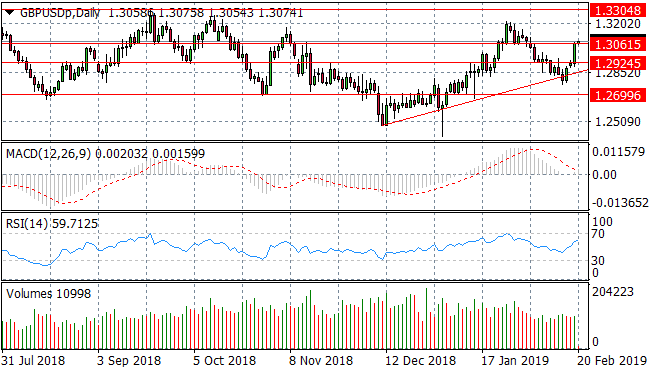
GBP/USD
The GBP/USD pair has broken through the 1.292 resistance level and is now testing the 1.306 price level. A break may create a new trading range between the 1.306 and 1.330 price levels. Buying pressure has risen into the move and RSI has an upward trajectory.

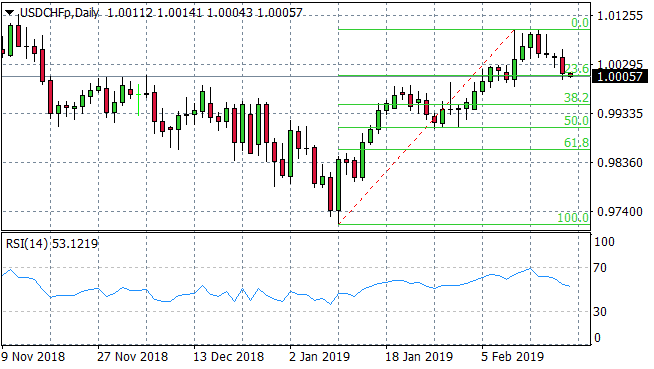
USD/CHF
The USD/CHF pair has pulled back towards the 23.6 Fibo level in a bearish retracement. Given the trajectory of RSI it seems unlikely that there will be a bullish reversal in the pair and price action will likely approach the 38.2% retracement area next.
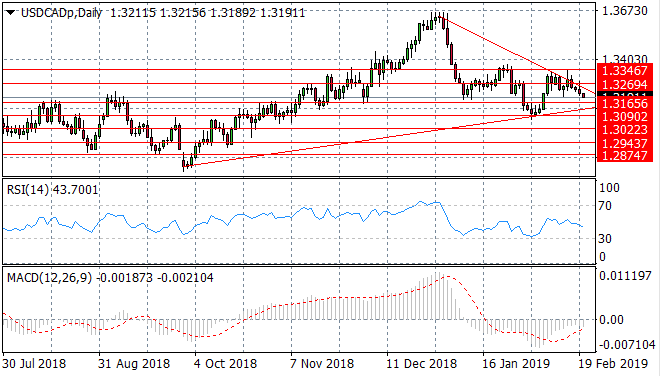
USD/CAD
The USD/CAD pair has entered into a symmetrical triangle with the upper resistance line containing price action currently. Failure at the descending trendline has resulted in sellers beginning to dominate price action. RSI has a downward trajectory and MACD remains in below the zero line.
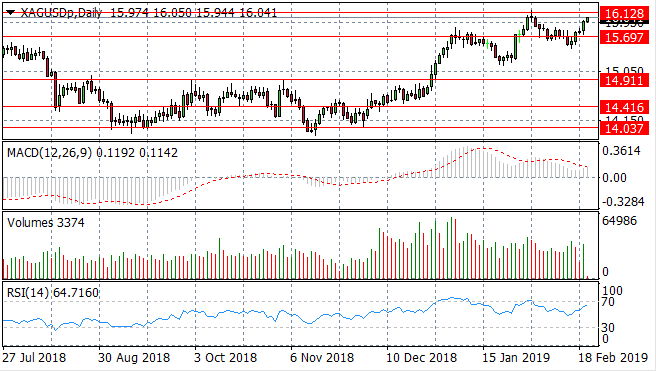
SILVER
Silver buyers have returned to push price action towards the 16.12 price level. A new trading range may have been established between the 15.69 and 16.12 price levels. Momentum indicators have resumed a bullish bias with RSI approaching overbought conditions.
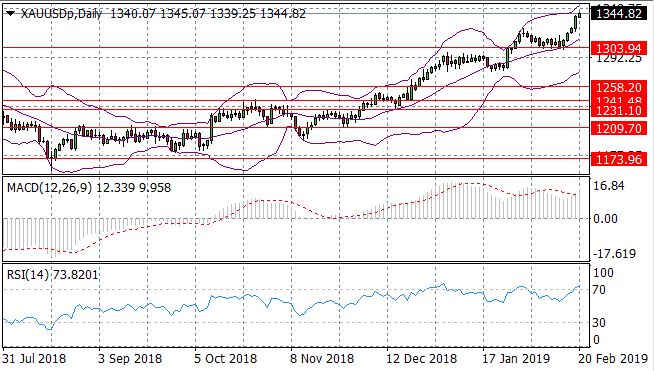
GOLD
Gold has broken the 1303.94 price level and it appears there is still room for further upside in price action for the metal, with a target of the upper bound of the Bollinger band in sight. Momentum indicators support the rally with MACD extending its bullish position and RSI reaching overbought conditions.
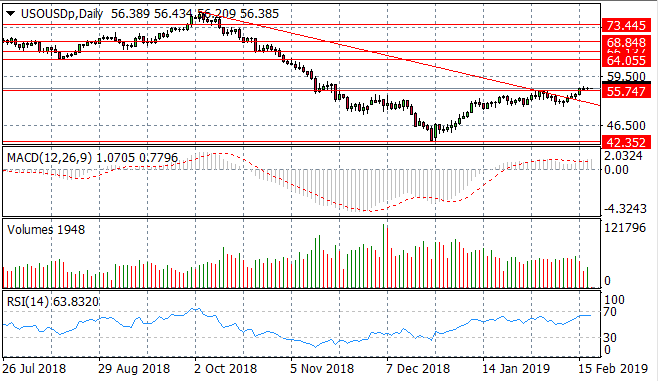
OIL
WTI buyers have returned to drive price action to the point where it tests a previous resistance line at $55.74 per barrel. The next target will be $60 per barrel at which point prices may stabilise. Momentum indicators have flat-lined, but remain moderately bullish.