US Dollar Is Subdued Ahead Of The Election
- 2 Nov 2020
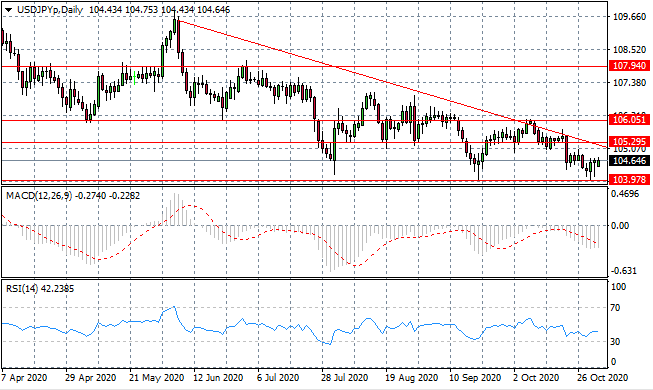
USD/JPY
The USD/JPY pair has rebounded from the price floor of 103.97 as buying activity has begun to rise in the pair. Price action has assumed a descending triangle pattern and therefore a bearish breakout may be anticipated. Will the US Dollar continue to be weak? Momentum indicators remain in bearish territory.
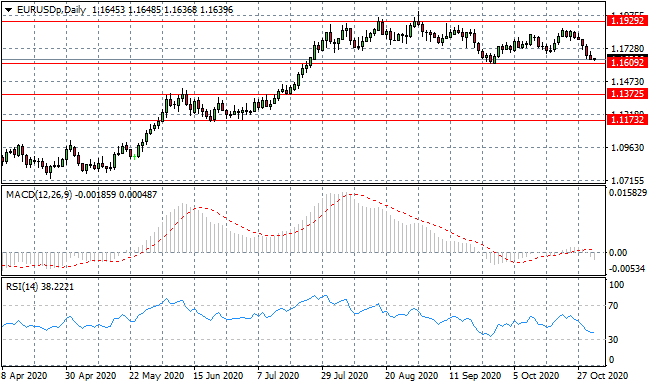
EUR/USD
Eurodollar sellers are dominating price action and there have been several tests of the trading range floor at the 1.160 price line. However, once again, the range seems likely to remain intact given the current lack of conviction. Momentum indicators are bearish.
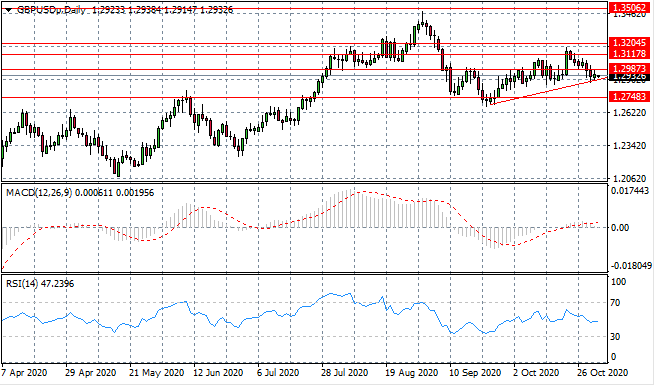
GBP/USD
Buyers are beginning to return to the pair at the ascending trendline indicating residual bullish sentiment, despite the recent sell-off. A bullish flag formation is building in the pair and will be confirmed by another strong bullish rebound from current price levels. Momentum indicators have flattened in the neutral zone.
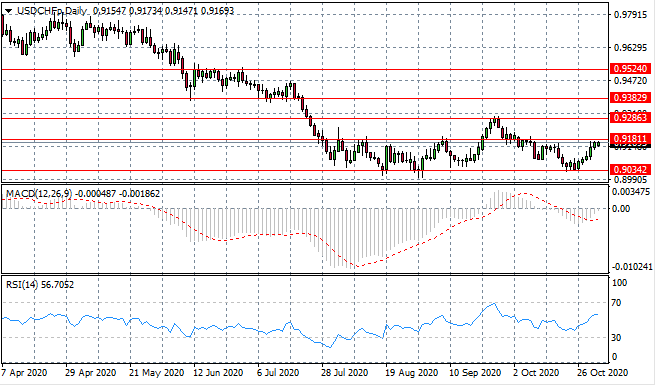
USD/CHF
The USD/CHF pair has moved to test the 0.918 resistance area, yet a break has not materialised despite healthy bullish momentum in six trading sessions. Smaller bodied candles indicate that conviction is waning and that the current range may remain intact. Momentum indicators support bullish momentum with upward trajectories.
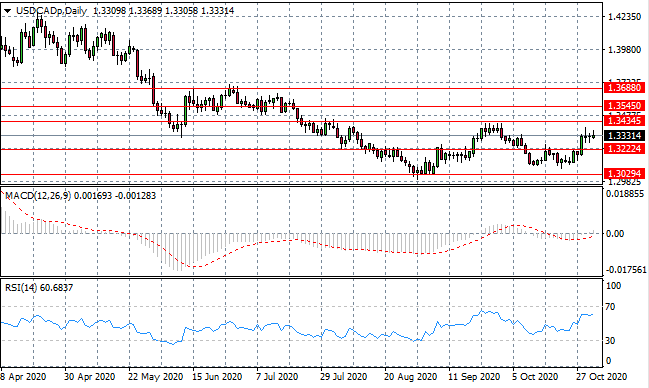
USD/CAD
The USD/CAD pair has stalled mid-range between the 1.322 and 1.343 price levels. There appears to be little appetite from buyers or sellers dominate price action. Buyers of US Dollar seem the most likely contributors to any future trends. Momentum indicators have upward trajectories.
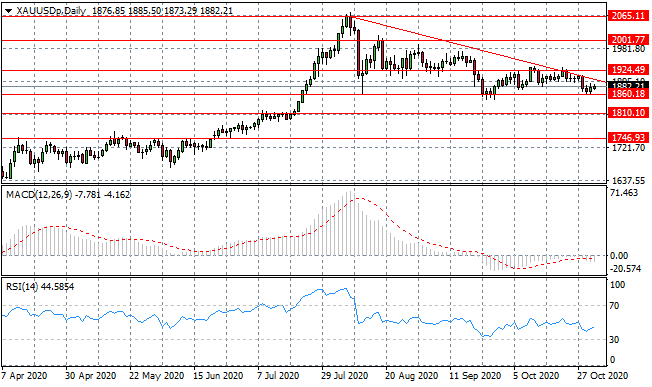
GOLD
Gold has moved to test the lower bound of a descending triangle pattern and yet another rebound has taken place. Another test of the descending trendline is expected as the metal moves closer to the apex. Momentum indicators have stalled in bearish territory.
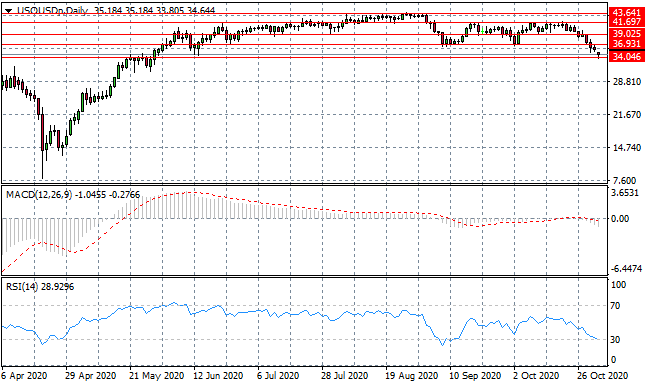
OIL
WTI is testing a key support level at the 34.04 price area which represents a previous resistance line. A break would be significant and indicative of longer-term bearish sentiment. The break of range in an of itself indicates that an oil price recovery is not the cards anytime soon. Momentum indicators are bearish, with RSI testing oversold conditions.