WTI Tests Key Support Level
- 30 Oct 2020
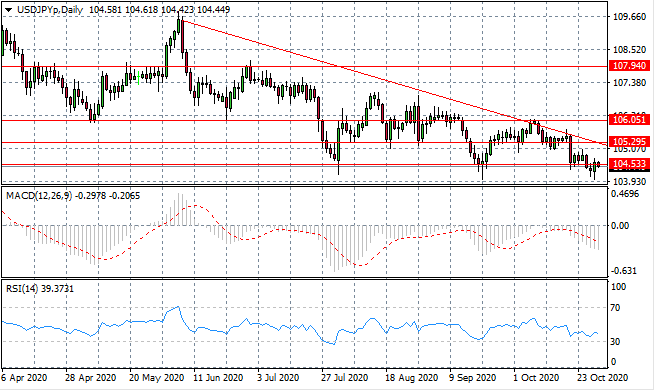
USD/JPY
The USD/JPY pair is still stuck at the 104.53 support area as a bullish rebound has taken place after the break. Given the longer-term trajectory for the pair and pattern of price action, a bearish breakout seems imminent. Sellers conviction currently remains weak. Momentum indicators remain in bearish territory.
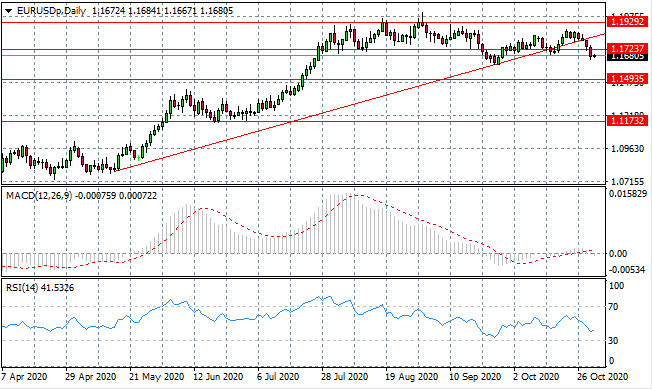
EUR/USD
Eurodollar sellers are beginning to take command of price action with both a break of the ascending trendline and the 1.172 support level. This support level has been an obstacle for sellers in the past, therefore the break is significant and may pave the way for a longer-term downtrend. Momentum indicators are bearish.
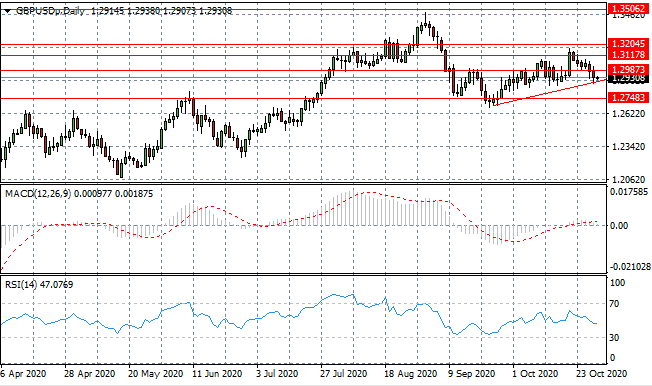
GBP/USD
The current GBP/USD rally is being tested at the ascending trendline, where an ascending flag appeared to be forming. If another rebound takes place from the trendline, it will serve as confirmation of the rally. Momentum indicators have flattened in the neutral zone.
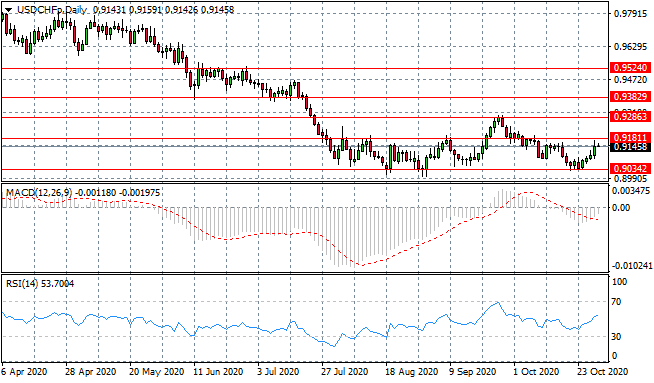
USD/CHF
The USD/CHF pair is edging closer to the 0.918 resistance area, which represents the ceiling of a recent consolidation channel. A break would confirm the reversal. Momentum indicators support bullish momentum with upward trajectories.
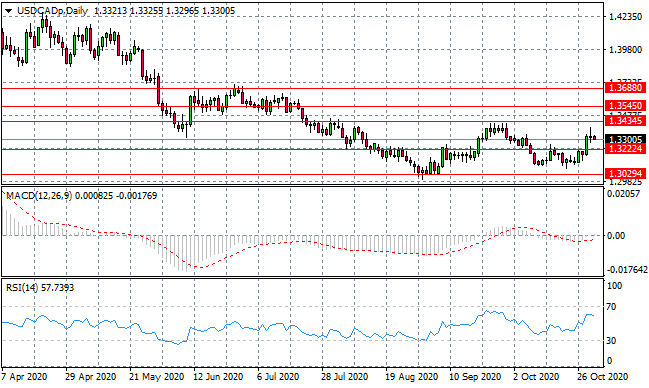
USD/CAD
The USD/CAD pair has re-entered a previous trading range between the 1.322 and 1.343 price levels. The rally appears to have stalled with a long legged doji candle indicating indecision. A full evening star doji pattern will indicate a trend change only of today’s candle remains bearish. Momentum indicators are mixed.
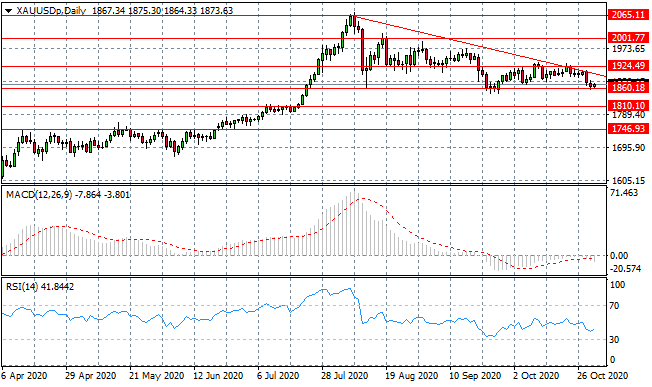
GOLD
Gold has moved to test the lower bound of a descending triangle pattern. A break has not yet materialised, yet the metal is moving closer to the apex. As oscillations narrow, a break seems imminent. Momentum indicators have stalled in bearish territory.
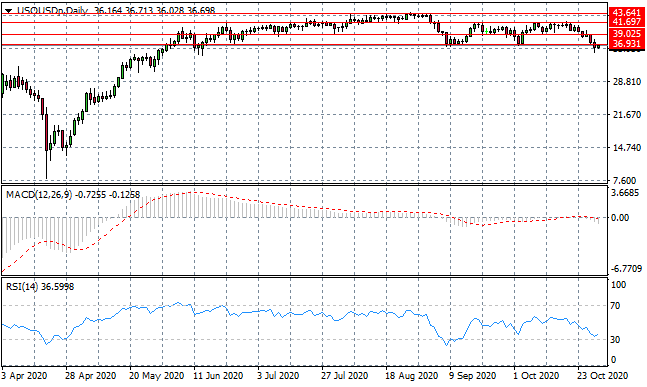
OIL
The current test of the 36.93 support level is significant as this range has been held since mid-June. Buyers appear to have returned in early trading, however, indicating that the current break may not be sustained. Momentum indicators are bearish, with RSI testing oversold conditions.