US500 Breaks Key Support Level
- 19 Jan 2022
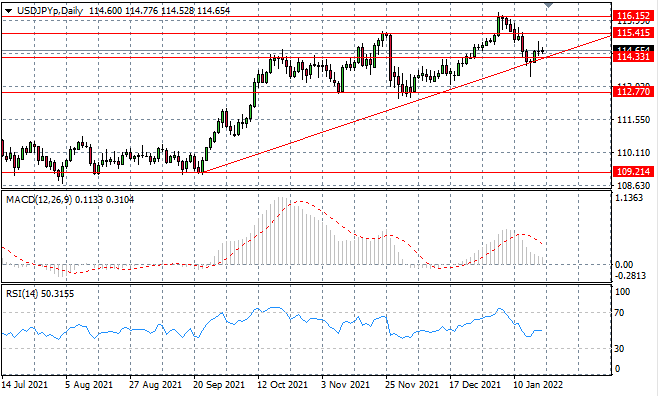
USD/JPY
The USDJPY pair has failed to find the support to drive a rally. A series of doji candles indicate indecision and lack of appetite from buyers. Given the rise in selling pressure in yesterday’s trading, we may now see another test of the trendline. Momentum indicators have flattened in neutral/bullish territory.
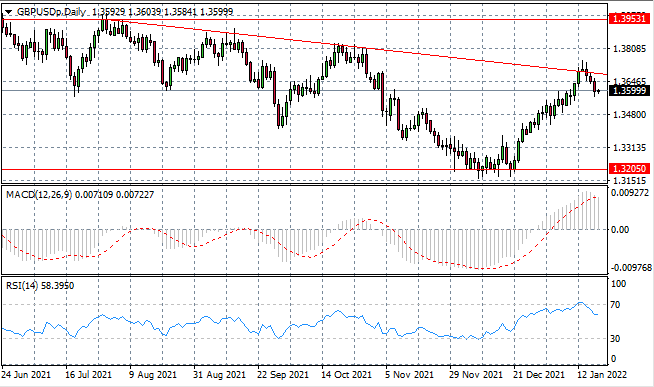
GBP/USD
GBPUSD sellers are beginning to dominate price action after the pair rejected the descending trendline, in further confirmation of the longer-term bearish bias. Oscillations had begun to widen in recent trading yet each oscillation has represented a lower high. Momentum indicators are undergoing reversals.
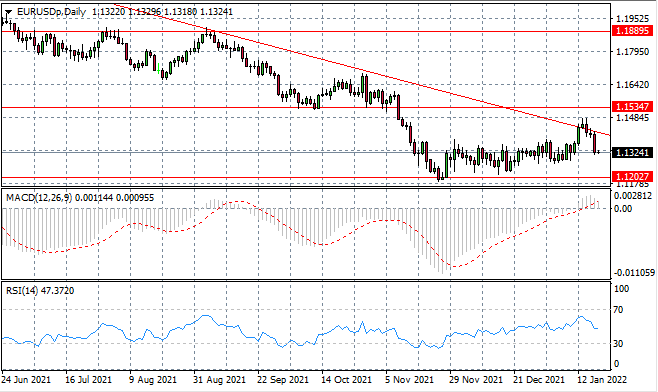
EURUSD
The EURUSD has rejected the descending trendline, as a sharp rising is selling activity in yesterday’s trading confirmed the reversal. A support level exists at the 1.120 price line, which has represented an obstacle for sellers in the past.
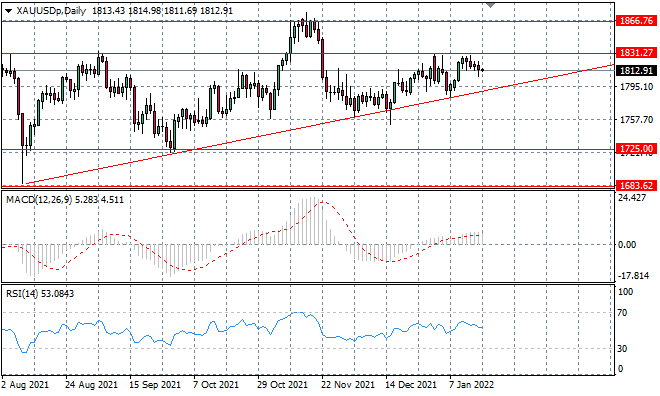
XAUUSD
XAUUSD price action has begun to pull away from the upper bound of the ascending triangle. Smaller bodied candles indicating uncertainty and that neither buyers nor sellers have the appetite to drive price action. A moderate bearish bias will likely take price action back to test the lower bound of the triangle.
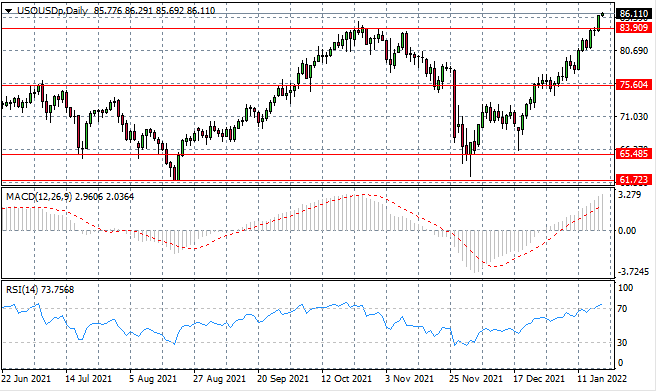
USOUSD
USOUSD has broken out of range moving passed a price ceiling at the 86.11 price line. The rally has plenty of support with only a handful of bearish trading sessions since December. Momentum indicators have sharp upward trajectories yet RSI has overshot the overbought line.
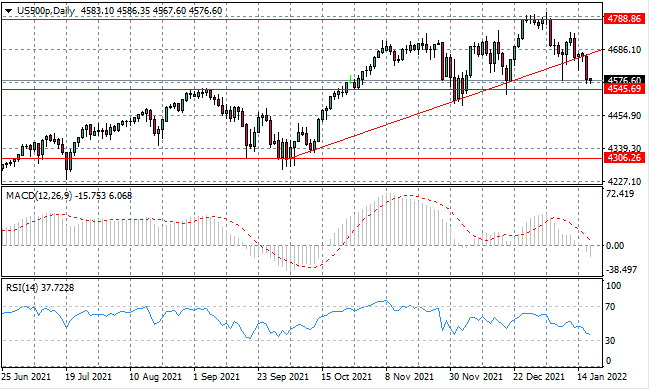
US500
US500 has broken through the descending trendline, which has held since September 2021. Clearly, this is significant and may be a signal of cooling bullish sentiment, whether it is a longer-term shift, remains to be seen. Momentum indicators suggest that the bearish momentum may not last as RSI approaches the oversold line.
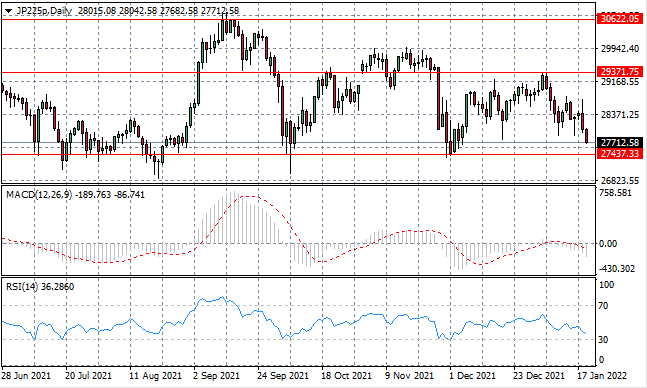
JP225
JP225 is fast approaching the lower bound of the consolidation channel the index has been oscillating in since November. A sharp rise in selling activity in recent trading is taking price action back towards the 27,437 support area. Momentum indicators reflect the bearish sentiment seen in price action.