WS30 Index Plummets Towards Key Support Line
- 20 Jan 2022
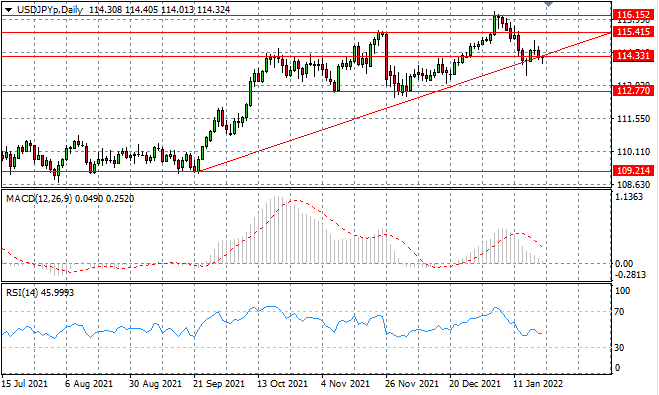
USD/JPY
The USDJPY pair has returned to the ascending trendline, as buying activity stalled, represented by the doji candle. A break has not materialised and this support level has contained price action since mid- September. Momentum indicators have downward trajectories.
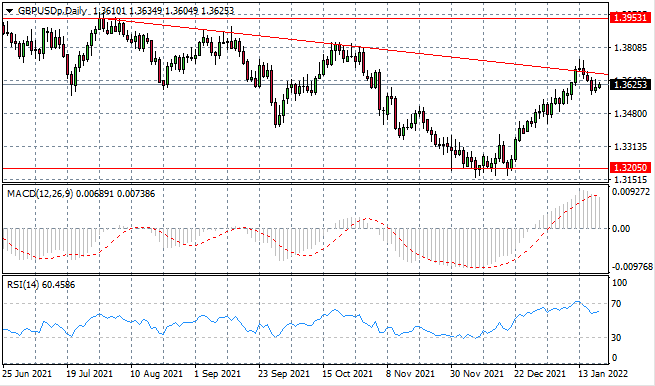
GBP/USD
GBPUSD sellers have pulled away from the descending trendline, yet buyers returned in both yesterday’s session and in the early Asian session today. Another attempt at the trendline will only result in a break if there is enough conviction behind the move. Momentum indicators have flattened in bullish territory.
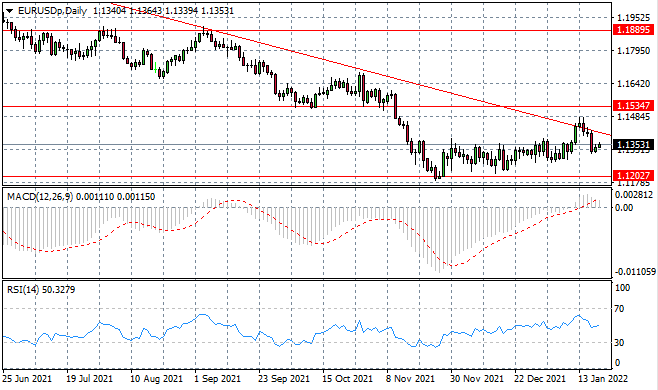
EURUSD
The EURUSD will make another attempt at the trendline which is a longer-term resistance area. Typically, attempts at this resistance area have resulted in pullbacks in price action. Bullish conviction currently appears insufficient to drive a break. Momentum indicators have downward trajectories.
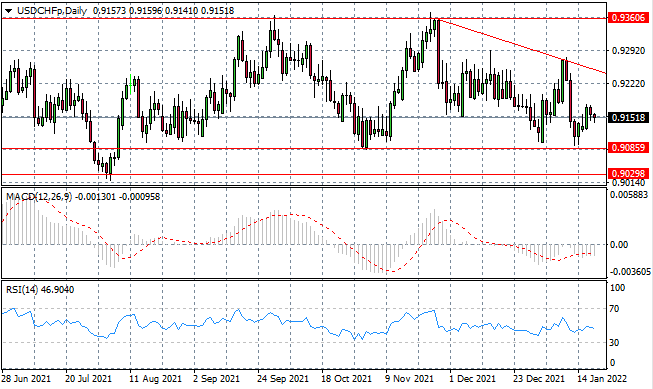
USDCHF
The USDCHF has failed to gather enough support to drive a rally in further confirmation that longer-term, a bearish bias still holds. Lower highs and lower lows confirm the downtrend, with the 0.908 support line representing the lower bound of the range.
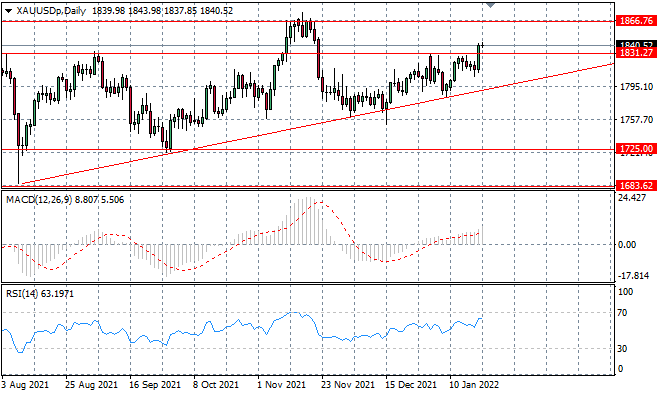
XAUUSD
XAUUSD price action has broken out of the ascending trendline and the upper bound of the pattern at the 1831 price level. The question now is; can the break be sustained? Another test will be the 1866 resistance level. Momentum indictors signal further upside potential although bullish momentum is decelerating.
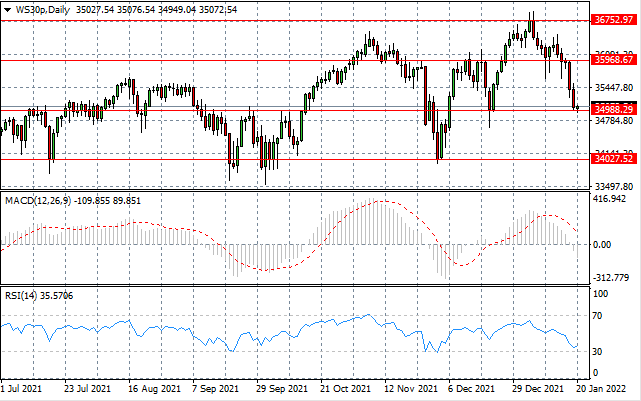
WS30
WS30 has plummeted in the last few trading sessions and as such, has returned to the 34,988 support line. On a previous occasion, price action rebounded from this support level. Momentum indicators are bearish with MACD breaking the zero line, however RSI is fast approaching the oversold line.
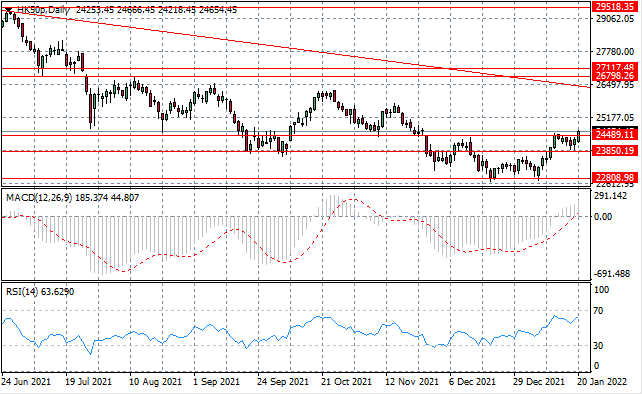
HK50
HK50 has broken through a recent consolidation channel and breached the 24,489 resistance line. The move could be the first sign of a reversal in sentiment. The next few trading sessions will determine whether the break can be sustained. Momentum indicators are bullish.