USD/CAD Breaks Key Support Level
- 7 Jan 2019
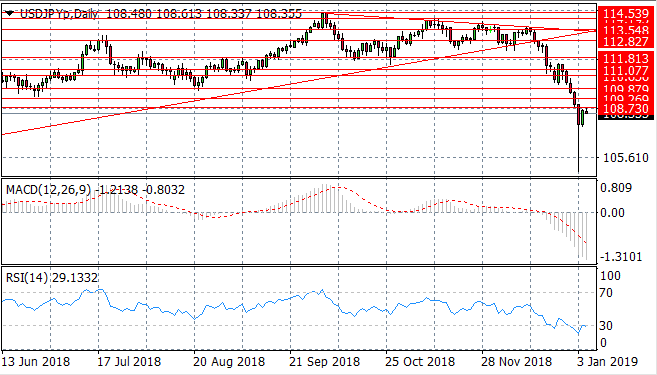
USD/JPY
The USD/JPY pair has made a recovery from a sharp sell-off last week. The 108.73 support level remains a target for buyers with a break indicating a full reversal. Momentum indicators have stalled in bearish conditions with RSI testing the 30 support level.
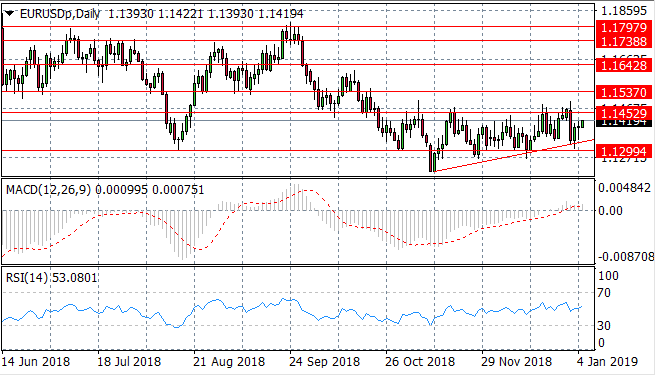
EUR/USD
The EUR/USD pair has once again bounced back from the ascending trendline with bullish momentum. The next target for buyers is the 1.145 price level where the pair will likely remain in the 1.129 and 1.145 trading range. Momentum indicators have turned bullish with MACD breaking the zero line.
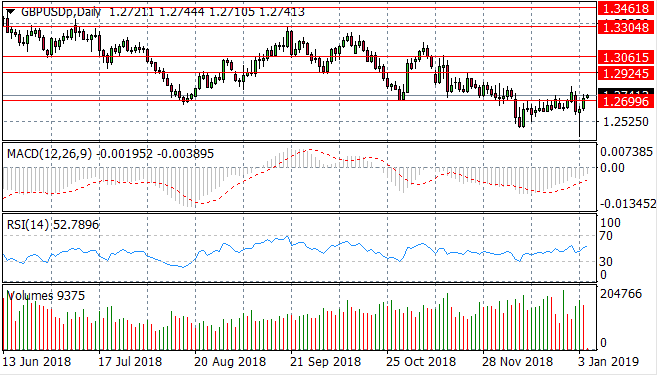
GBP/USD
The GBP/USD pair has also made a recovery from the sell-off last week and has broken the 1.269 price level. In recent trading, the pair has struggled to move beyond this key resistance area. Momentum indicators have maintained an overall upward trajectory with MACD approaching the zero line.
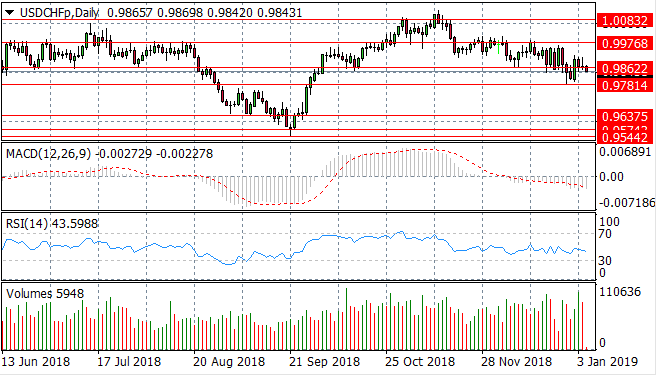
USD/CHF
The USD/CHF pair continues to test the 0.986 price level. It is currently unclear as to whether buyers or sellers will dominate near-term price action. Momentum indicators are neutral if slightly bearish with RSI bouncing back from the 30 support level.
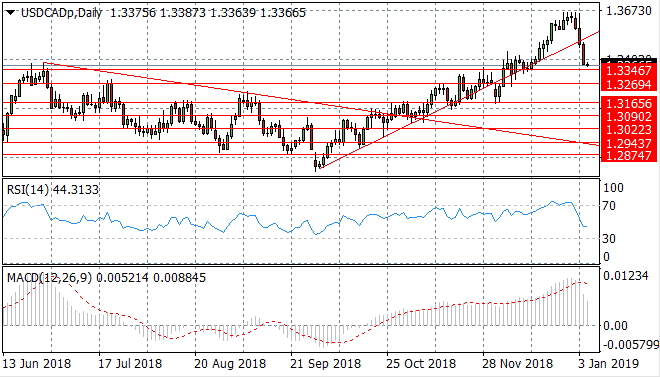
USD/CAD
The USD/CAD pair has pulled back from a long-term uptrend and as a result has broken the ascending trendline which has been acting as a support level for the pair. The next target for sellers is the 1.334 price level. Momentum indicators also reflect the bearish sentiment; with MACD and RSI both undertaking a momentum reversal.
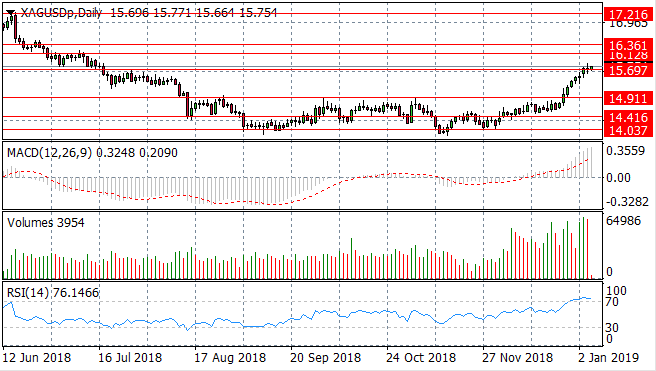
SILVER
Silver has broken the 15.69 price level however, a rise in selling volume may suggest that the rally is coming to an end. Doji candles represent indecision and generally occur ahead of a reversal in price action. Momentum indicators remain bullish, however, RSI has flattened at the 70 resistance level.
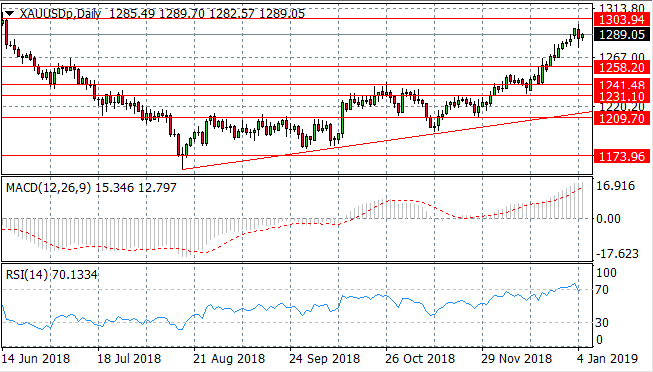
GOLD
Gold has broken a long-term resistance area at the 1258.20 price level and is now approaching a price high of 1303.94. Sellers have returned, however, which has caused a pause in the rally. RSI has returned towards the 70 resistance area.
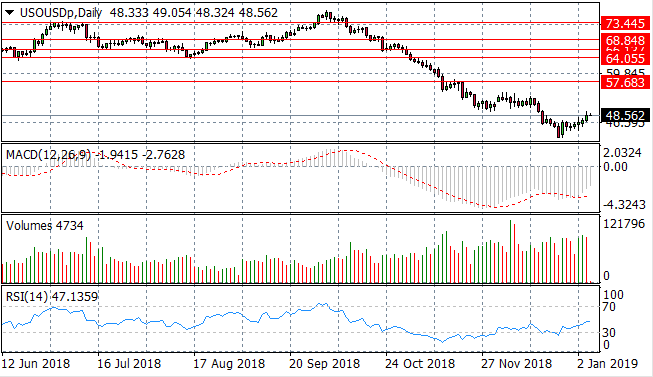
OIL
WTI buyers appear to be attempting another recovery as price action climbs towards $50 per barrel. Momentum indicators have begun a moderate bullish reversal, despite selling activity rising. How long the rally will last remains the question; especially considering the oversupply concerns which have plagued global oil markets.