USD/JPY Pair Test Key Support Area
- 24 Sep 2019
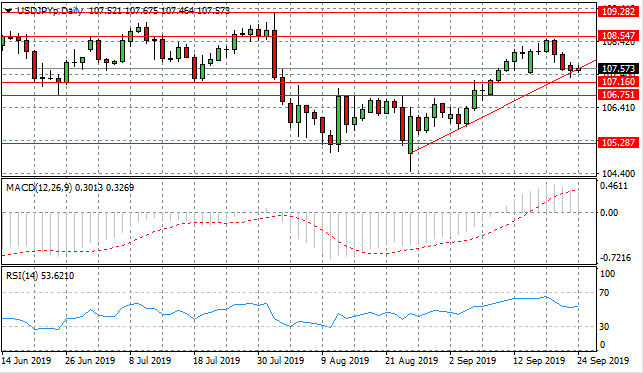
USD/JPY
The USD/JPY pair has fallen back to the ascending trendline as sellers have returned to the pair. On previous occasions, price action has rebounded from the ascending trendline and will likely head back towards the 108.54 resistance line. Momentum indicators have retraced from bullish positions with RSI pulling away from overbought conditions.
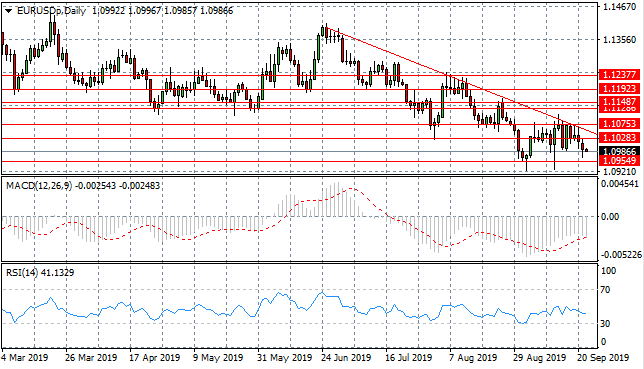
EUR/USD
The Euro once again has rejected the resistance area at the descending trendline, which represents a ceiling for the pair. A bearish breakout may be imminent as the pair moves towards the apex of a descending triangle which will likely take price action below the 1.095 support level. Momentum indicators have stalled in bearish territory.
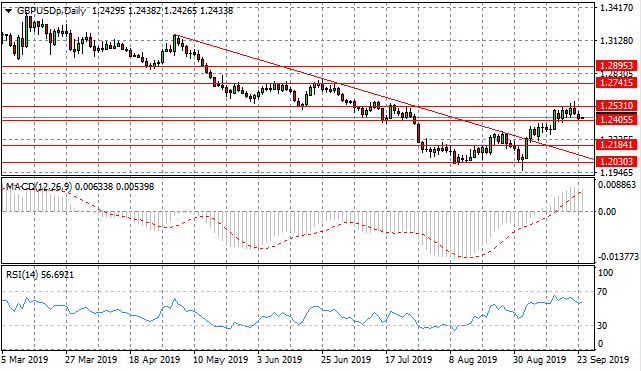
GBP/USD
The GBP/USD pair has been unable to break the 1.253 resistance area in recent trading, with price action falling back towards the 1.240 support level. Geopolitical events are likely to impact the pair going forward. Momentum indicators remain in bullish territory, however, RSI is pulling back from overbought conditions.
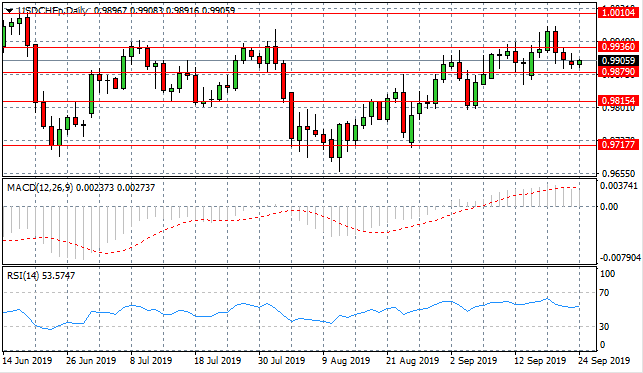
USD/CHF
The USD/CHF pair has reversed the break of the 0.993 resistance line and as such price action is now heading towards the 0.987. Buyers have returned yet price action may remain between the 0.987 and the 0.993 price levels. Momentum indicators are pulling back from bullish territory suggesting the rally has come to an end.
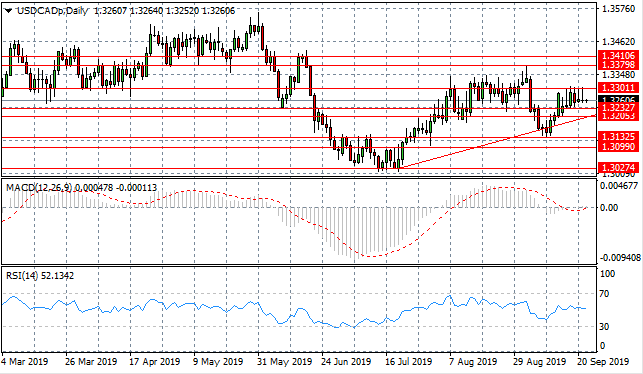
USD/CAD
The USD/CAD pair has once again pulled back from the 1.330 resistance line as selling pressure rises. A trading range between the 1.323 and 1.330 price levels may be established. Momentum indicators have flattened in neutral/bullish territory with MACD testing the zero line and RSI moving into the buying channel.
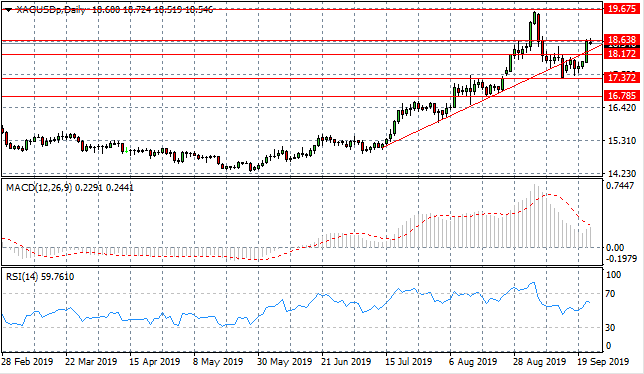
SILVER
Silver is once again testing the 18.63 resistance line as buyers return to the pair and facilitate another rally. The next target for the price action will be the 19.67 resistance line. Rising uncertainty has resulted in buyers returning to the metal. Momentum indicators remain in bullish territory yet have pulled back from overbought conditions.
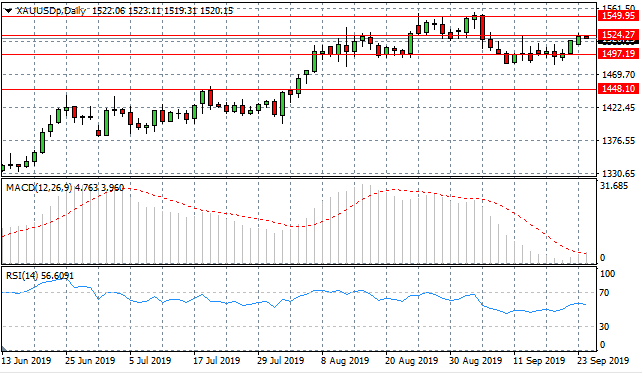
GOLD
Gold is testing the 1524 price level once again as the metal fails to break the 1497 support level. Price action is likely to oscillate within this tight trading range with a peak at the 1549 price level. Momentum indicators are bullish, with MACD rising from the zero line and RSI moving into bullish territory.
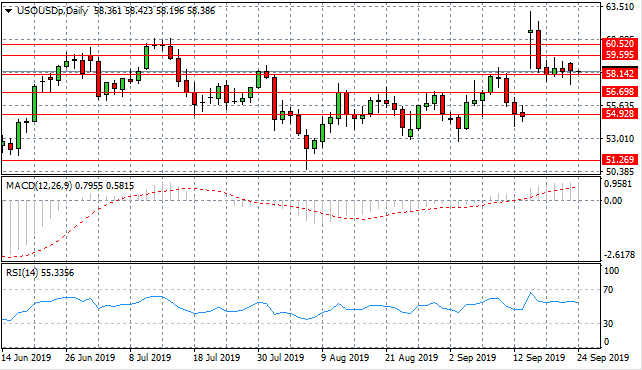
OIL
A full bearish reversal has taken place and WTI price has now moved to test the $58 per barrel price area. This has represented a strong support area in recent trading. Momentum indicators are bullish with MACD breaking the zero line to the upside yet RSI has flattened in the bullish channel.