USD/JPY Sell-Off Continues
- 5 Aug 2019
Kickstart your new year with the best USD50 bonus campaign. Limited-time offer! Get it now!
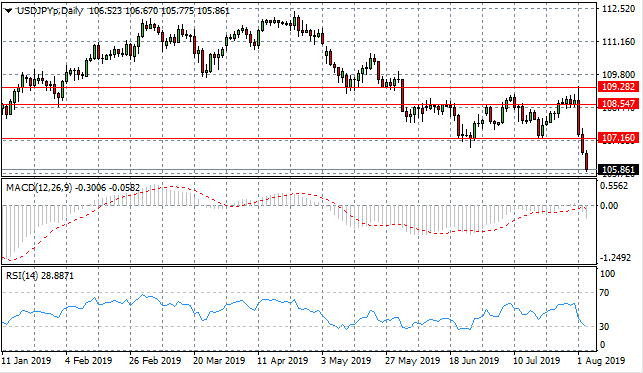
USD/JPY
The USD/JPY pair has broken the 107.16 price level after geopolitical tensions intensified and central bank intervention impacted the US Dollar at the end of last week. A recent price floor exists at the 104.77 support level. Momentum indicators suggest that price action may reach this level as MACD extends into bearish territory and RSI approaches oversold conditions.
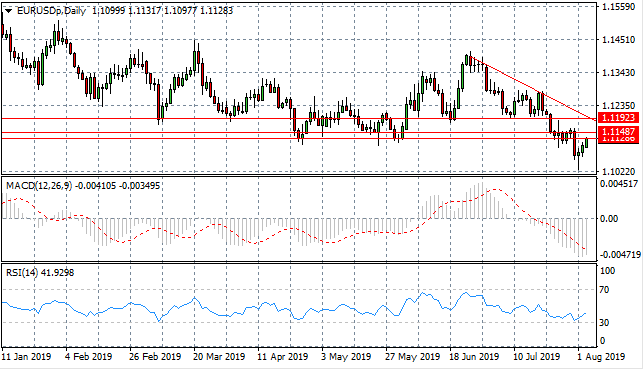
EUR/USD
The Euro has made a recovery off the back of dollar weakness. The EUR/USD had reached multi-year lows after breaking the 1.112 price floor. A hammer candle at the bottom of the sell-off represented the beginning of a sharp bullish reversal, rising to test the 1.112 floor. Momentum indicators support the bullish reversal.
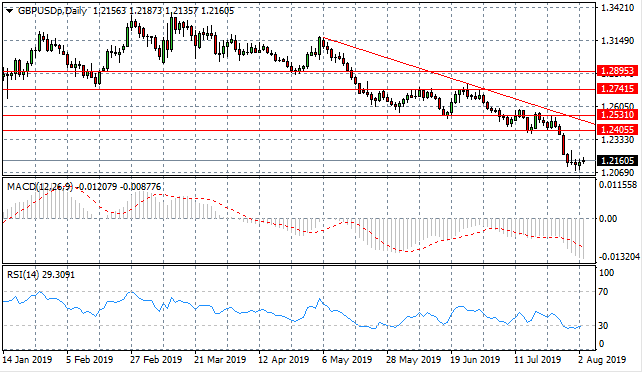
GBP/USD
The GBP/USD pair also appears to be making a recovery as a series of doji candles represent a deceleration in the sell-off. Positive sentiment may not last, however, as the pair continues to be impacted by political developments. Momentum indicators support a bullish reversal; with RSI flattening at the oversold support line and slowing bearish sentiment on MACD.

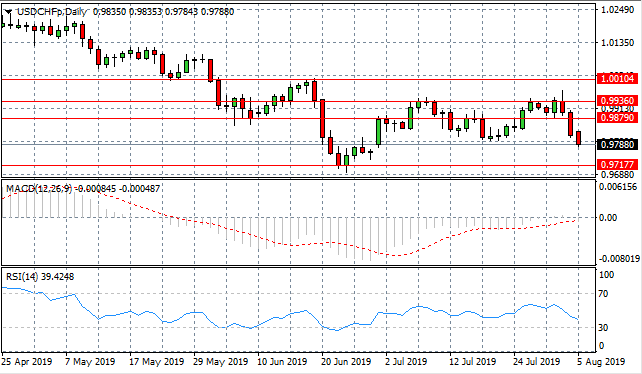
USD/CHF
The USD/CHF pair has also suffered a sell-off taking price action towards the 0.971 support level, which on previous occasions, has resulted in a rebound in price action. A trading range between the 0.971 and 0.987 price levels may be established. Momentum indicators have divergent trajectories yet RSI approaching oversold conditions.
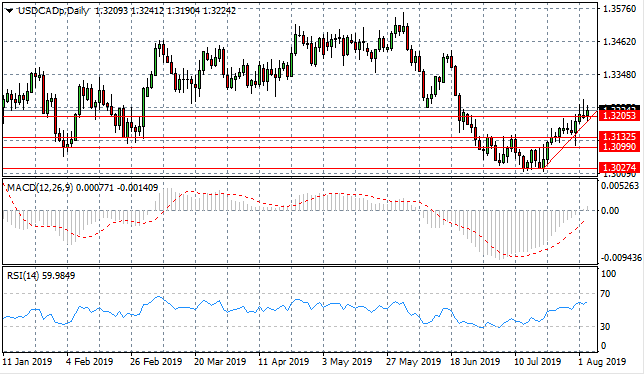
USD/CAD
The USD/CAD pair continues to test the 1.320 resistance line as breaks have been met with heavy selling pressure. A full close above the resistance line will provide weight to the rally. Momentum indicators are sharply bullish with MACD breaking the zero line to the upside and RSI approaching oversold conditions.
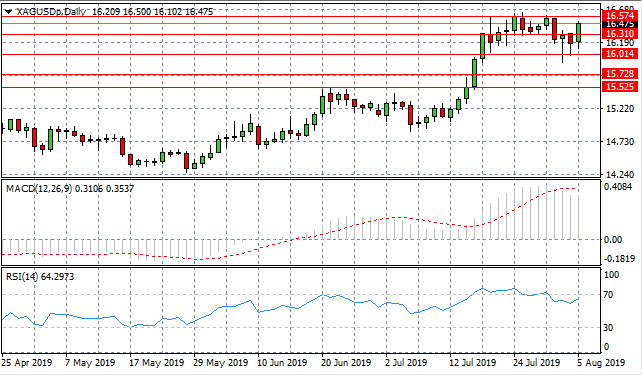
SILVER
Silver has rejected the 16.57 resistance level on several occasions yet buying momentum continues whilst price action moves horizontally. Current price action may just be a pullback in the rally. Momentum indicators are also pulling back from overbought conditions with MACD beginning a downward trajectory and RSI breaking the 70 resistance line.
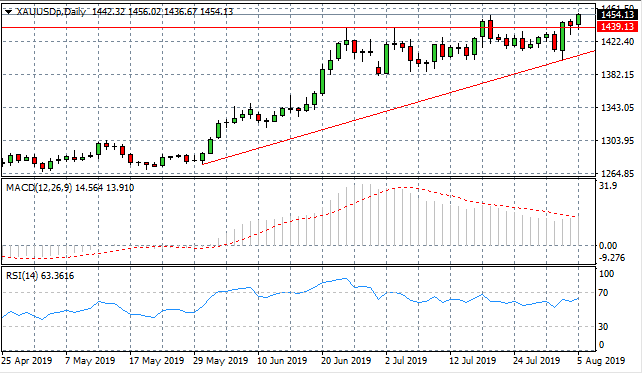
GOLD
Gold has broken the 1439.13 price level providing further weight to the rally, as a breakout takes price action beyond the upper bound of an ascending triangle pattern. Momentum indicators are turning more bullish as MACD extends into bullish territory and RSI approaches overbought conditions.
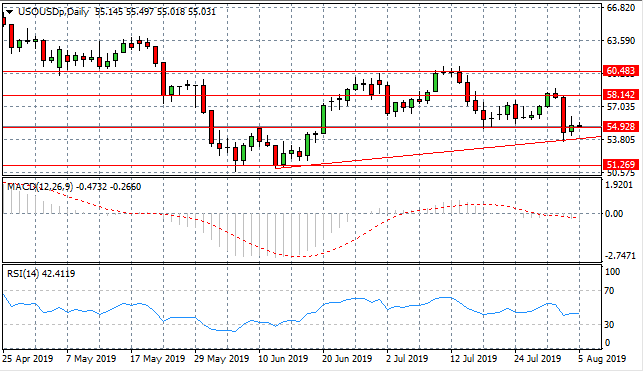
OIL
WTI has rejected the 58.14 resistance line and is now testing the 54.92 support line and has spiked to the ascending trendline, where buyers have returned. Therefore, the 54.92 support level and ascending trendline remain intact. Momentum indicators are bearish, with MACD breaking the zero line to the downside and RSI heading into the bearish channel.
Follow Us on Facebook:
