USDCAD On The Verge Of A Bearish Breakout?
- 19 Feb 2021
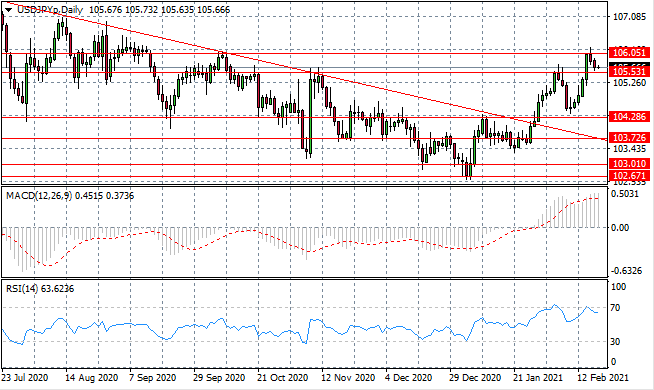
USD/JPY
The USD/JPY pair hit the 106.05 resistance level and pulled back towards the 105.53 price line as the rally struggles to move beyond a previous hurdle. Buyers conviction will now be tested as the pair moves towards the 105.53 support level. Momentum indicators remain in bullish territory with RSI pulling away from overbought conditions.
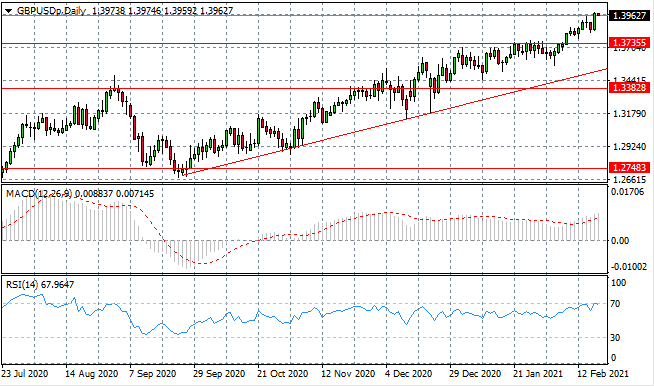
GBP/USD
The GBPUSD rally has taken the pair to multi-year highs after breaking the upper bound of an ascending triangle. Given the fact that a longer-term rally is well-established, it will take a significant change in fundamental factors to facilitate a trend change. Momentum indicators are bullish with RSI testing overbought conditions.
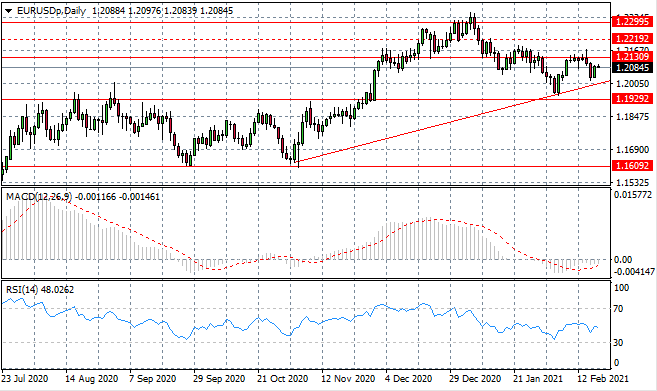
EURUSD
The Eurodollar has bounced back from the ascending trendline once again, as bullish momentum takes price action towards the 1.213 resistance line. This price area has proven to be an obstacle to rallies in the past. Momentum indicators have flattened in neutral/bearish territory.
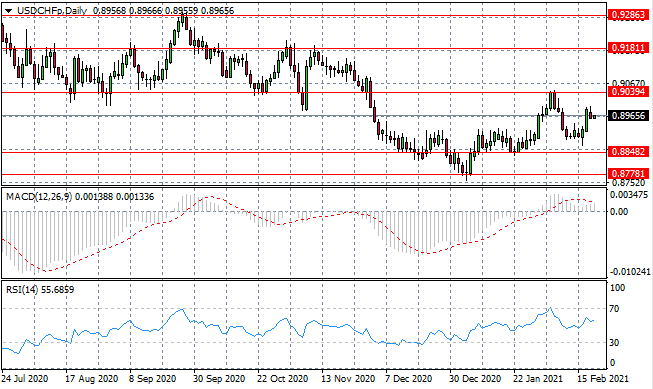
USDCHF
The USDCHF pair continues to oscillate within a consolidation channel between the 0.884 and 0.903 price levels. The current trading range will likely remain intact until there is a change in fundamental factors. Momentum indicators have flattened in bullish territory.
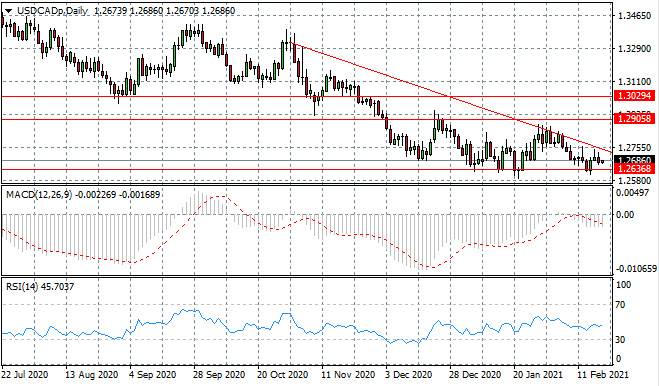
USDCAD
The USDCAD is edging towards the apex of a descending triangle as climbing oil prices put the pair under pressure. The 1.263 price level represents the lower bound of the triangle and has contained price action on previous break attempts. Momentum indicators have flattened in bearish territory.
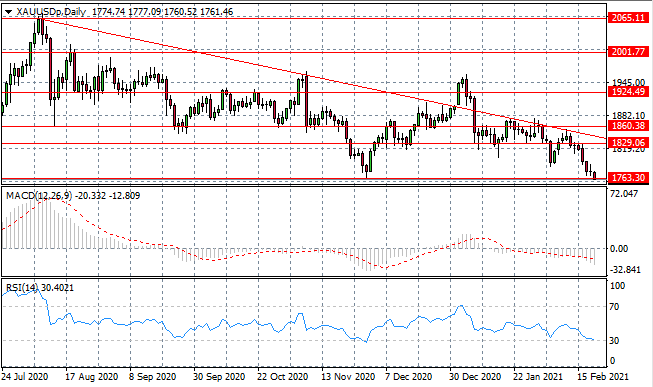
XAUUSD
XAUUSD has come under significant pressure which has taken price action towards a recent low at the 1763.30 support level. Long-term bearish sentiment appears set to continue for the near-term. Momentum indicators have flattened in bearish territory with RSI testing the 30 support level.
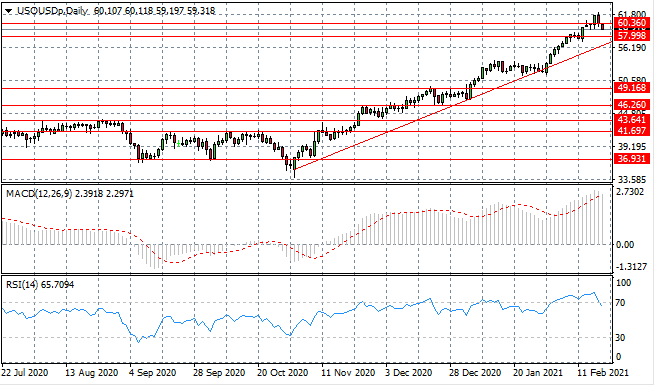
USOUSD
The USOUSD has pulled back to test the $60 per barrel range, with the next target at the 57.99 support level. Pullbacks are likely to represent dips in the rally rather than a trend change especially as economic conditions continue to improve. Momentum indicators are undergoing reversals with RSI testing the overbought line.
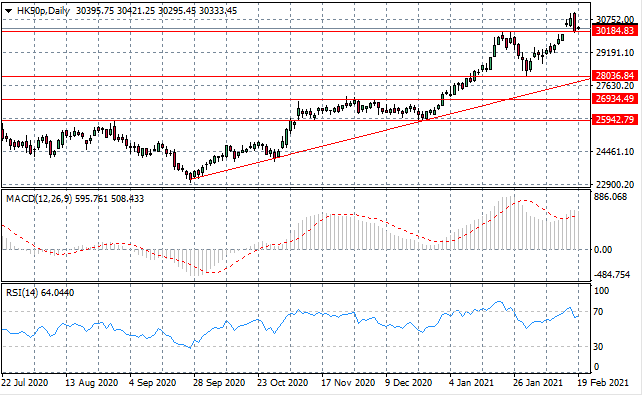
HK50
The HK50 has pulled back to the 30,184.83 support level, where a breakaway gap towards the end of the rally signaled potential for a reversal or pullback. Sellers conviction will be tested, with a break confirming an end to the rally. Momentum indicators are bullish with RSI testing the overbought line.