USDCAD Rejects Key Resistance Line
- 26 Jan 2022
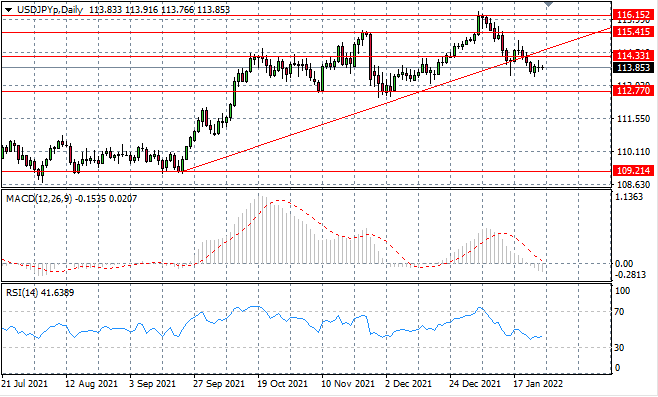
USD/JPY
The USDJPY pair has broken the trendline to the downside where price action has now stalled. Initially, buyers were active in yesterday’s trading but there is a lack of support and as such, momentum has stalled. Consolidation within the current range seems the most likely near-term direction for price action.
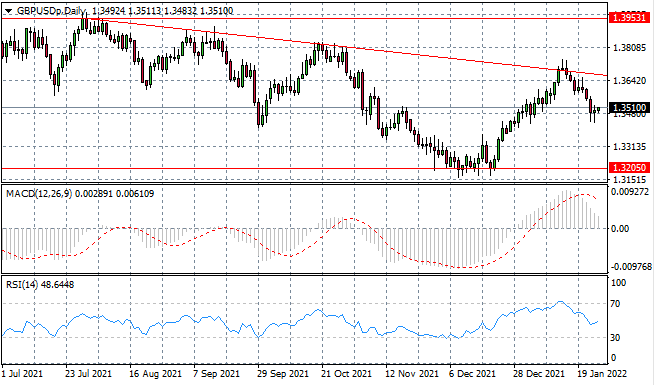
GBP/USD
GBPUSD pair continues to oscillate whilst being contained by the upper descending trendline. Oscillations have begun to narrow and another attempt on the trendline appears to be underway. Given that the trendline has held as a resistance since July last year, significant bullish momentum will be required to drive a break.
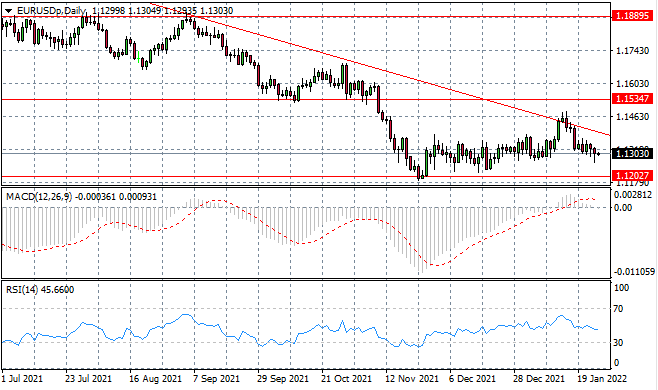
EURUSD
The EURUSD has failed to assemble a rally and price action is once again giving way to bearish sentiment. The pair is moving closer to the apex of a descending triangle with the 1.120 support level representing the lower bound. Typically, a bearish breakout can be anticipated with this pattern of price action.
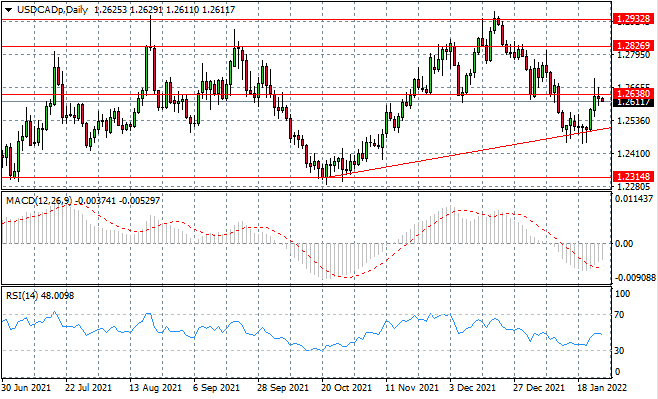
USDCAD
The USDCAD has begun to pullback from the 1.263 resistance level as a rise in selling pressure forming around the resistance area prevented the break. Bearish momentum appears to be weak currently, yet we may expect a return to the ascending trendline in due course.
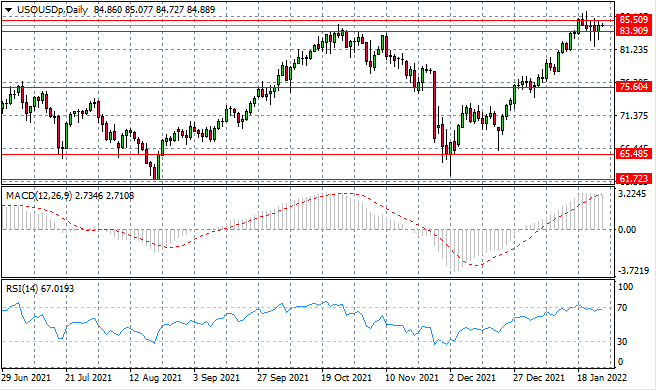
USOUSD
USOUSD price action has begun to float along the 83.90 support line as neither buyers nor sellers have been able to drive near-term price action. Small-bodied candles represent indecision and moves will default to the picture in fundamentals.
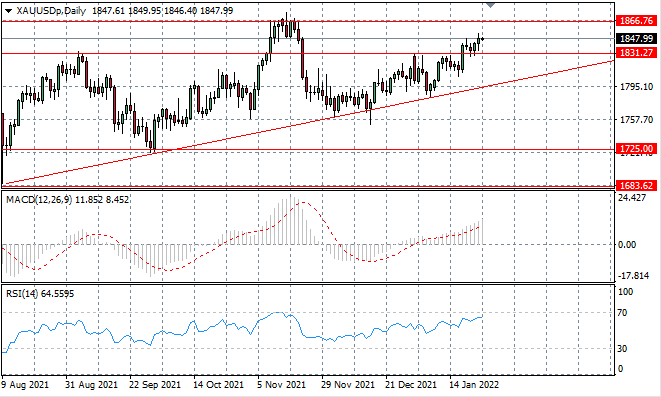
XAUSD
XAUUSD has found support and price action is heading back towards a recent high at the 1866 price line. Overall, the longer-term trajectory is bullish for the metal yet bullish momentum has been lacking, leading to moderate oscillations in the rally. Momentum indicators are reaching overbought conditions.
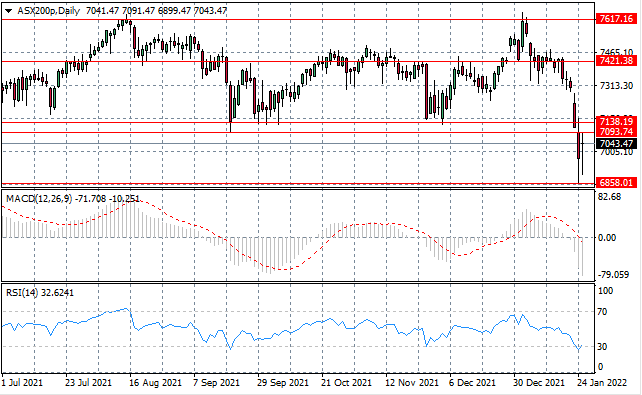
ASX200
ASX200 appears to be beginning a bullish recovery after a sharp sell-off period for the index. Long shadows represent a strong battle between buyers and sellers, yet bearish sentiment has dominated. RSI has begun a bullish momentum reversal and has broken back above the 30 line.