USDCHF Rockets Towards Price Ceiling
- 14 Mar 2022
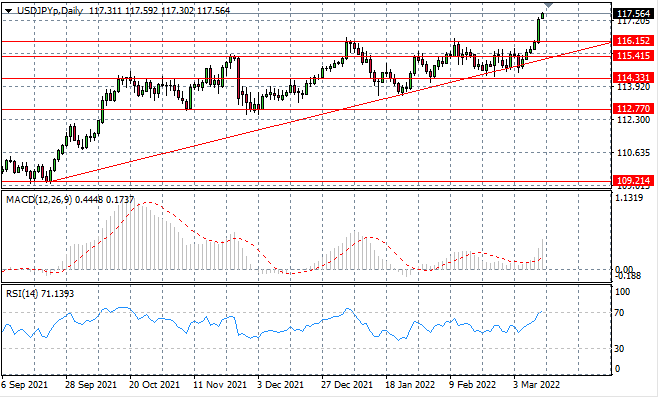
USD/JPY
USDJPY price action has broken out of the trading range which contained rallies since December 2021. A break of the 116.15 price line has been driven by strong bullish candles, indicating considerable support for US Dollar buying. Momentum indicators are bullish although RSI is testing overbought conditions.
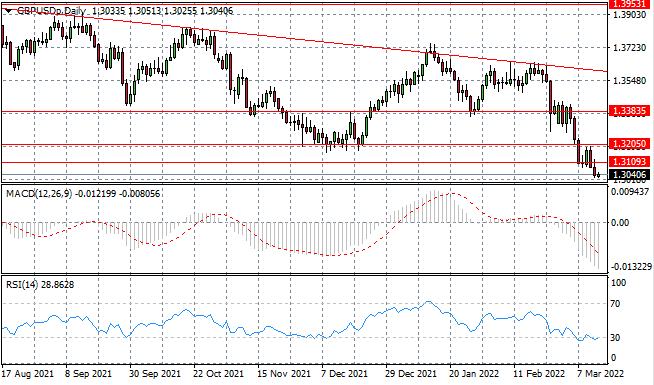
GBP/USD
The GBPUSD pair has finally broken the 1.310 support level after several attempts and a rise in volatility. Bearish sentiment has dominated medium term price action and reflects a longer-term trend. However, momentum indicators suggest that further downside may be limited with RSI bouncing along the 30 support line.
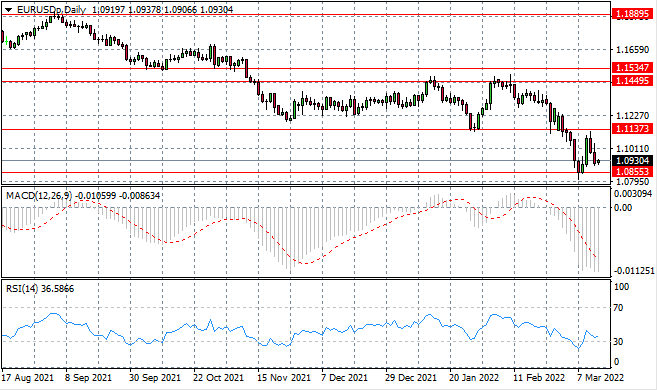
EURUSD
The EURUSD has pulled back, once again, towards the 1.0855 support level as bearish sentiment began to rise in the previous week of trading. Buying activity has begun in the early Asian trading session and a new trading week. Momentum indicators reflect bullish reversal attempts but remain in bearish territory.
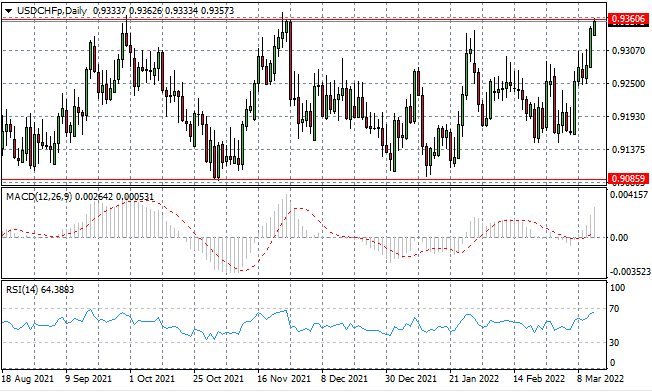
USDCHF
The USDCHF has rocketed towards the 0.9360 resistance line as bullish sentiment has risen sharply in recent trading. The resistance are represents a price ceiling which has contained rallies since September 2021, therefore a break would be significant. Momentum indicators are bullish with RSI approaching the overbought line.
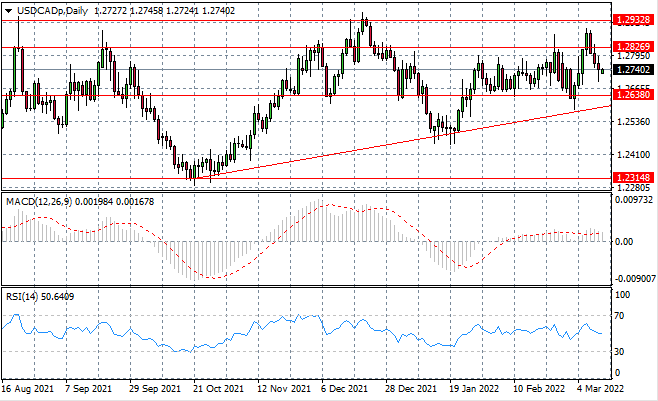
USDCAD
The USDCAD has fallen back further into the previous consolidation channel, yet bearish momentum appears to be stalling. A small-bodied candle to end last week’s trading signaled a strong tussle between buyers and sellers. Momentum indicators have downward trajectories yet remain in neutral/bullish territory.
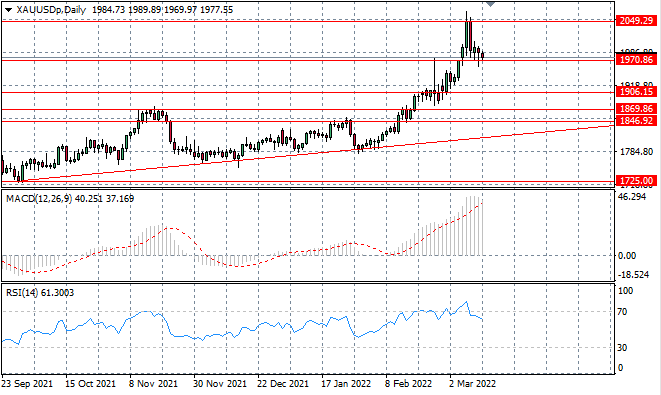
XAUUSD
The XAUUSD continues to test the 1970 support line as as buying pressure begins to rise at this support level. So far, bullish activity has contained a break and therefore the pair may now consolidate at this price level. Momentum indicators are undergoing reversals with downward trajectories.
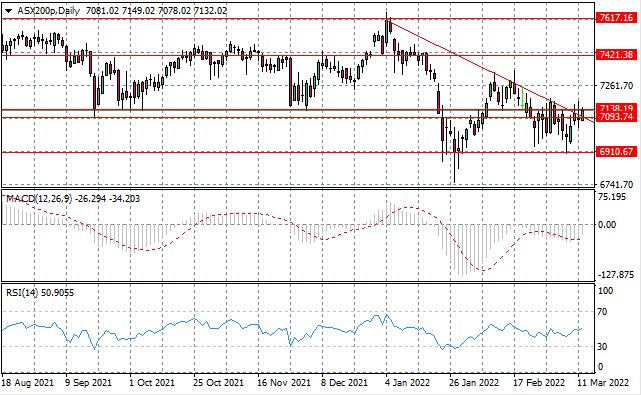
ASX200
The ASX200 has broken the descending trendline and 7093 support line and is now testing the 7138 resistance line, as bullish momentum drives price action. The trendline has contained previous rallies and a break may now take the index back to the previous trading range. Momentum indicators are bullish.