ASX200 Tests Key Resistance Line
- 11 Mar 2022
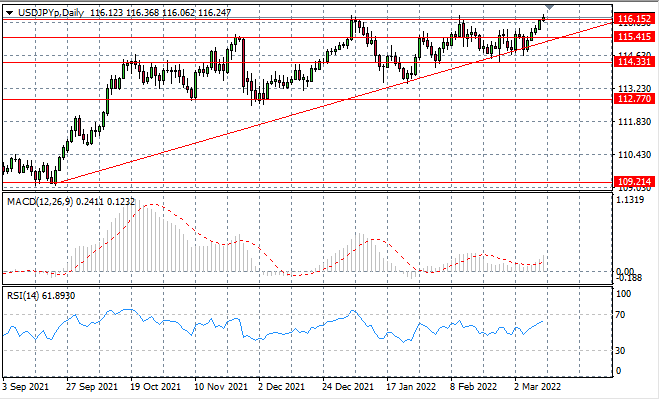
USD/JPY
USDJPY price action has still failed to break the 116.15 resistance line, as bullish momentum has stalled at this recent price ceiling. Longer-term sentiment is bullish with the trendline acting as support. Momentum indicators have upward trajectories with RSI approaching overbought conditions.
GBP/USD
The GBPUSD pair has dropped towards the 1.310 support level and a break appears to be underway. A previous break attempt was short-lived and followed by a rise in buying activity making this price line a key support area for the pair. Momentum indicators have flattened in bearish territory.

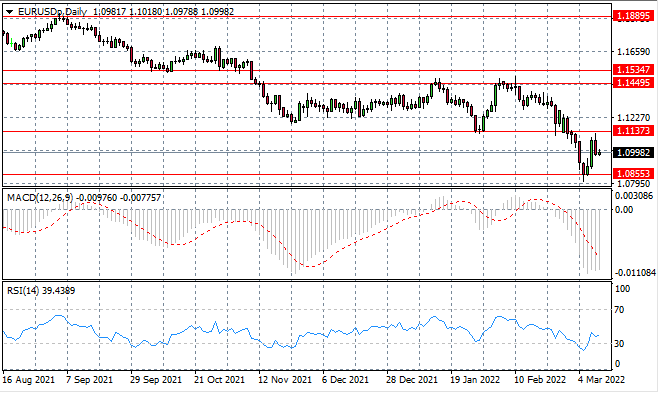
EURUSD
The EURUSD has failed before reaching the 1.113 price level, as selling activity has kept the pair within the 1.085- 1.113 trading range. which represents a key support level of a previous trading range. The strong bullish move has been met with resistance in the early Asian trading session, however, indicating the rally attempt may not last.
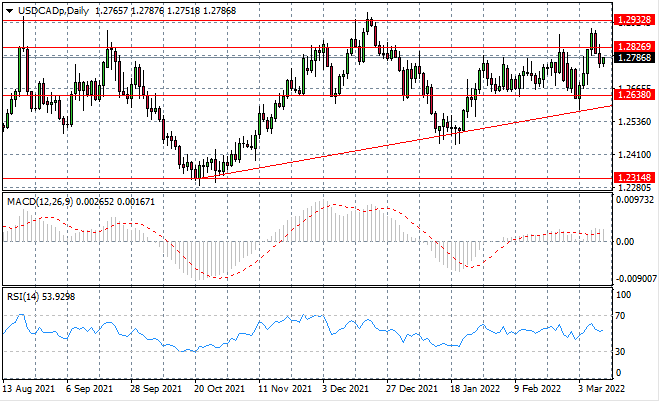
USDCAD
The USDCAD has fallen back to the previous consolidation channel as the bullish break failed to sustain. Selling activity has dominated the pair in the last few trading sessions and price action is likely to be contained within the channel. Momentum indicators have flattened in neutral/bullish territory.
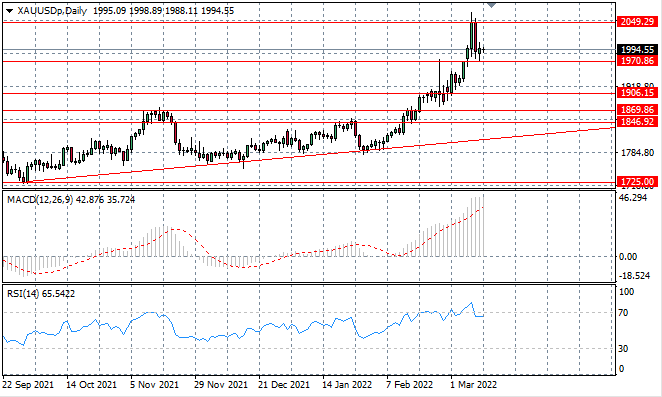
XAUUSD
The XAUUSD volatility has mellowed towards the end of the trading week. Small-bodied candles indicate a slowdown in the selloff as bears take stock. Price action is likely to be contained by the 1970 support level until further developments in fundamentals.
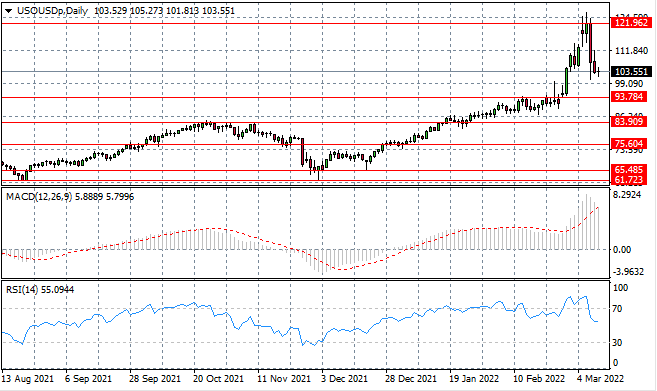
USOUSD
The USOUSD has stalled at the 103 per barrel level with a support level at the 93.78 price line. Selling activity had begun to wane yet was kickstarted again in yesterday’s trading. Momentum indicators signal that a reversal is underway although the flattening trajectories confirm sellers are losing steam.
ASX200
The ASX200 is testing the descending trendline which has effectively contained rallies since December 2021. Selling pressure in the last two sessions indicate that another bearish move is on the cards. Momentum indicators are bearish with upward trajectories.

