USOUSD Hits $90 Per Barrel Range
- 7 Feb 2022
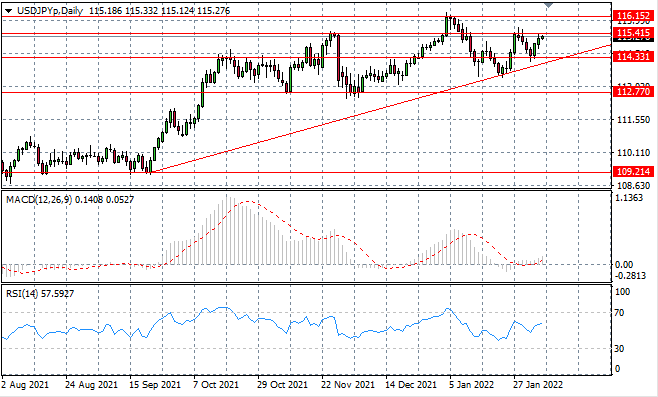
USD/JPY
The USDJPY pair has moved back to the 115.41 price level after rebounding from the 114.33 support level. Given this oscillation has tested the resistance line once before, resulting in a bearish pullback, conviction from buyers will need to be strong. Momentum indicators have bullish trajectories.
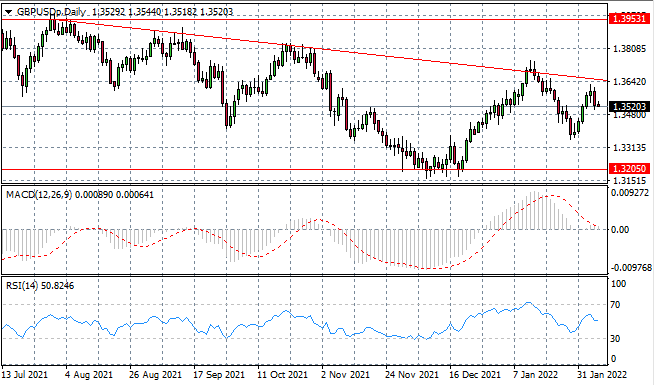
GBP/USD
The GBPUSD pair has begun to pullback after moving towards the descending trendline, following the trajectory of previous tests and also confirming the bearish bias. Oscillations have begun to widen in recent trading yet the pair is reaching lower highs. MACD is testing the zero line and a downside break may be on the cards.
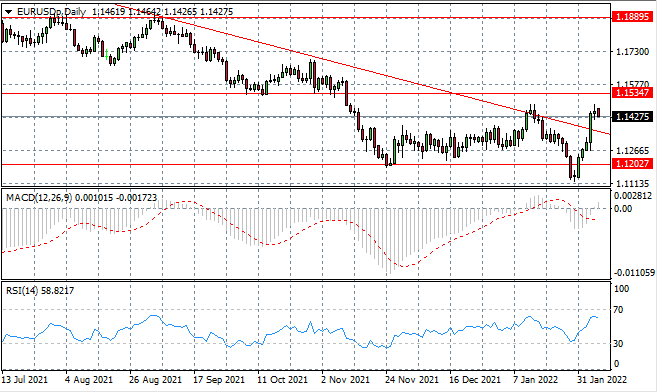
EURUSD
The EURUSD break has been met with a rise in selling activity as the bullish move begin to stall from lack of support. Price action may now move back towards the trendline which will serve as a support level going forward. Momentum indicators are stalling in bullish territory.
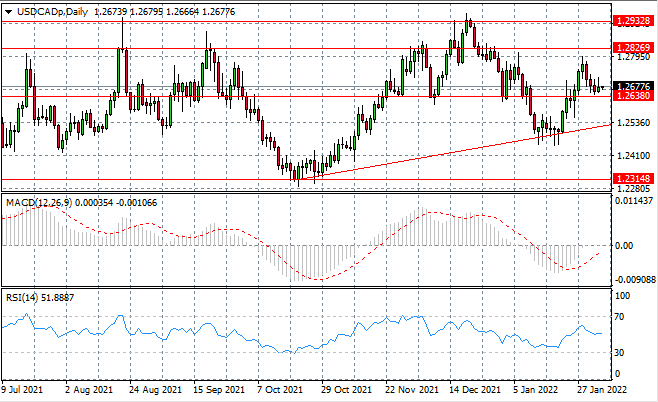
USDCAD
The USDCAD has moved back towards the 1.263 support line which has remain a key obstacle to sell-offs in the pair. Despite selling pressure, buyers have stalled the downward move. The current channel between the 1.263 and 1.282 price levels will likely remain intact.
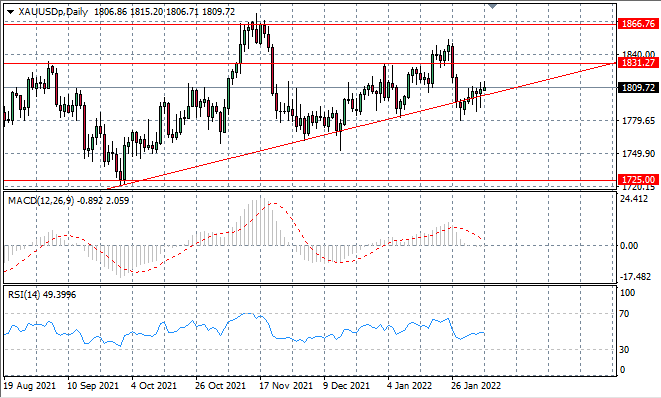
XAUUSD
XAUUSD is shrouded in indecision as small-bodied candle trace the trendline upwards with strong buying pressure failing to drive a rally. A longer-term bullish trajectory is beginning to form as price action has oscillated higher since September 2021.
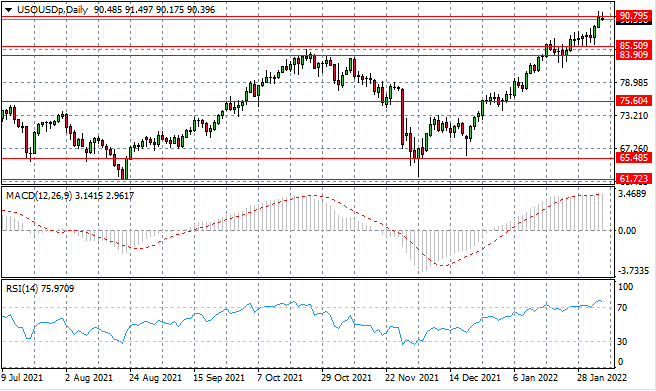
USOUSD
USOUSD has begun to move away from the 90.75 resistance level as moderate selling pressure begins to rise. The commodity may not have enough support to sustain the $90 per barrel range in the near-term and the trajectory for the USOUSD will be determined in the next few trading sessions.
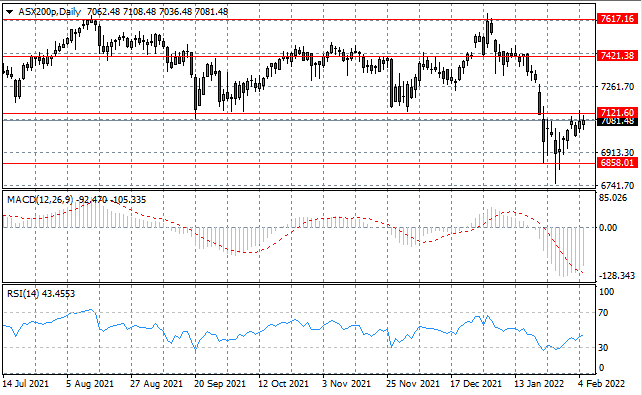
ASX200
ASX200 has begun to climb back towards the 7,121 resistance line, yet in the last few trading sessions, selling activity has begun to rise, indicating that there may be a lack of bullish momentum to drive the break. A spike through the resistance level in the previous session failed to result in a break. Momentum indicators have upward trajectories.