USOUSD Reversal Underway
- 9 Feb 2022
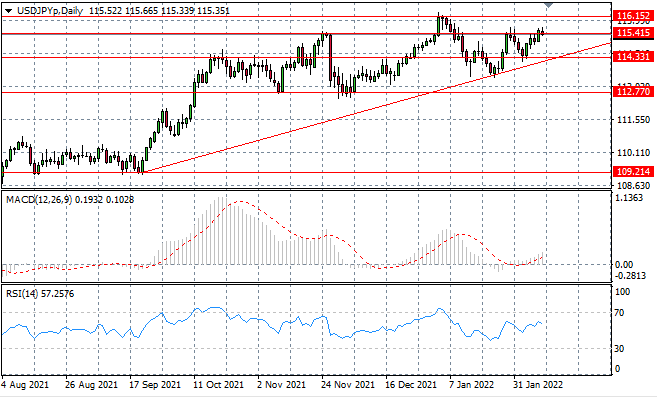
USD/JPY
The USDJPY pair continues to stall at the 115.41 price level, as buying momentum begins to slow. Several tests of this price area have resulted in bearish rebounds and that may be the case once again. Momentum indicators have stalled in bullish territory.
GBP/USD
The GBPUSD pair has started to move upwards, as a series of doji candles in the last few trading sessions have resulted in the return of buyers. So far, the descending trendline has contained price action and typically price action rejects this resistance area. Momentum indicators are moderately bullish.

EURUSD
The EURUSD is beginning to turn back towards the descending trendline as buyers lose steam mid-rally. Price action has stalled however, as neither buyers nor sellers appear to have the conviction to drive a trend. The pair seems likely to float in the current range between 1.120 and 1.153 price levels.

XAUUSD
XAUUSD is beginning to climb back towards the 1828 resistance level which has represented a key obstacle for buyers on at least three previous occasions. Longer-term sentiment is bullish. Momentum indicators are divergent with MACD approaching the zero line and RSI forming an upward trajectory.

HK50
The HK50 index has moved back towards the 25,085 resistance line, as buyers will make another rally attempt after trading mostly in range for the last 3 months. Given that price action rejected this resistance level on a previous occasion, strong conviction will be required to drive the break.

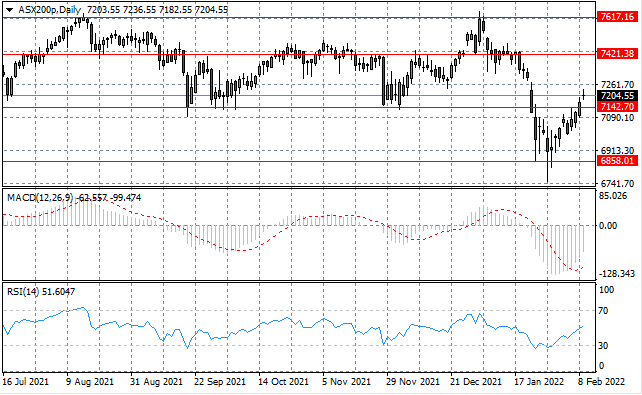
ASX200
ASX200 has broken the 7,121 resistance line, yet a doji candle to start the trading session may infer a lack of support for the rally. The gap up may not be sustained and the pair may now linger within the new trading range in the near-term.
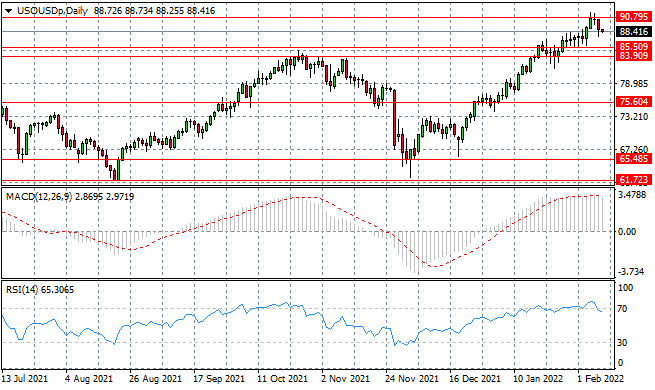
USOUSD
USOUSD has begun to pull away from the $90 per barrel range and return to a previous trading range between the 85.50 and 90.79 price levels. Buying pressure remains as denoted by the long lower shadow in yesterday’s trading. Momentum indicators are beginning reversals.