XAUUSD Takes Flight
- 18 May 2021
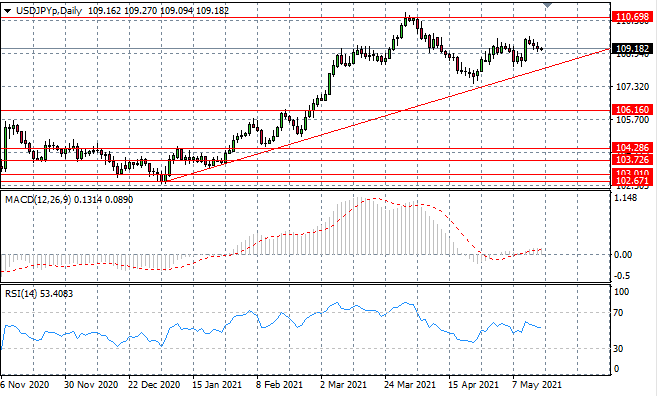
USD/JPY
The USDJPY is floating back towards the ascending trendline, with a series of doji forming a bearish move. The pair will likely continue to oscillate in a narrower range and the longer-term bullish bias will likely continue perhaps at a more moderate pace. Momentum indicators are bullish, with MACD testing the zero line.
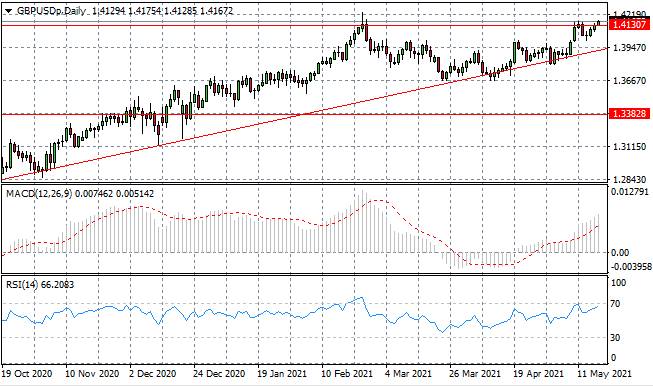
GBP/USD
The GBPUSD pair has broken the 1.413 resistance level, which is significant, considering the pair has rejected this price line on several previous occasions. The question is whether the break can be sustained as bullish momentum is weak. Momentum indicators suggest that the pair is overbought.
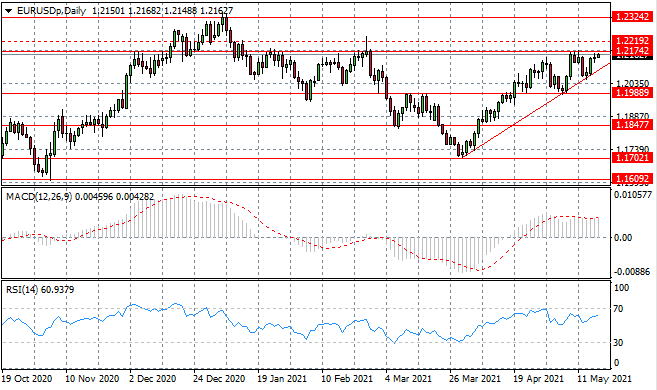
EURUSD
The Eurodollar is moving towards the 1.217 price line which represents a strong resistance area for the pair which, so far, in recent trading, buyers have been unable to overcome. A clear uptrend has formed with a sharp exponential indicating sentiment is firmly bullish. A break seems imminent. Momentum indicators are bullish.
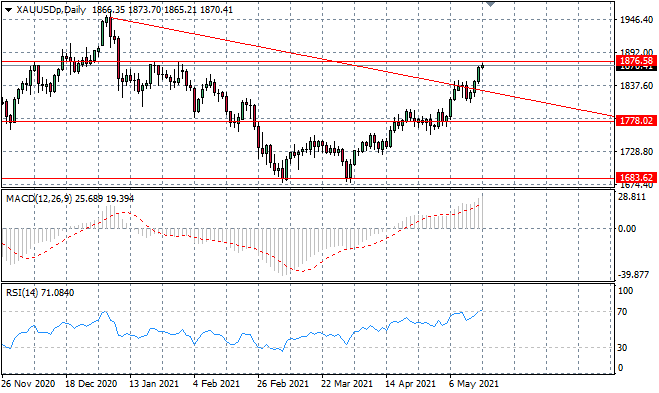
XAUUSD
XAUUSD has found support and has now moved to test the 1876.58 price level. A break would mean a return to pre-pandemic price levels and would therefore mean a significant breakthrough for the metal that has been under pressure since mid-December 2020. Momentum indicators are bullish with RSI testing overbought conditions.
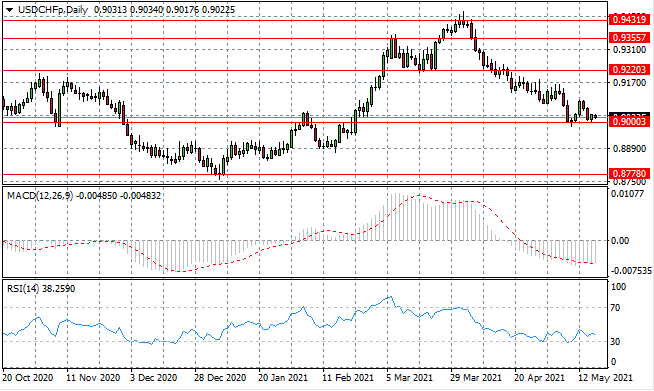
USDCHF
The USDCHF sell-off may be faltering as the pair has stalled at the 0.900 support line. Buyers have made a few attempts to facilitate a change in price direction, yet bearish sentiment prevails. Momentum indicators are bearish with RSI testing the 30 line.
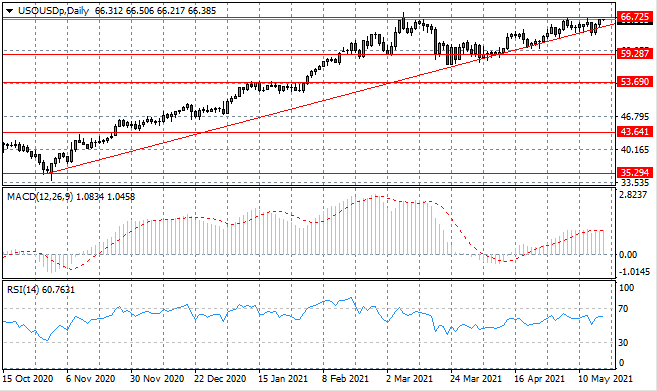
USOUSD
USOUSD buyers have returned and we anticipate a break out of the $60 per barrel range. Another test of the upper bound of the ascending triangle after another narrowing in oscillations signals a bullish move. Despite several attempts, a break is yet to materialise. Momentum indicators have flattened in bullish territory.
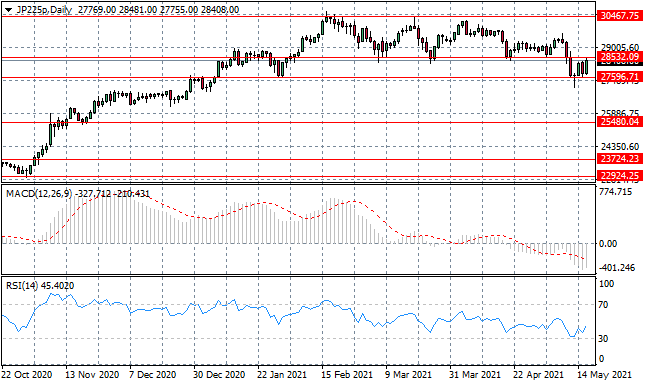
JP225
The JP225 has rebounded from the 27596 price level as the index has now moved to test the 28532 resistance area, which represents a previous support. A break would mean the return to a long-term consolidation range. Momentum indicators are forming upward trajectories.