Technical Analysis
Can Silver Break The Long-Term Downtrend?
- 18 Sep 2018
How can you diversify your trading with indices? Join Lauren on 28Sept to learn more now.
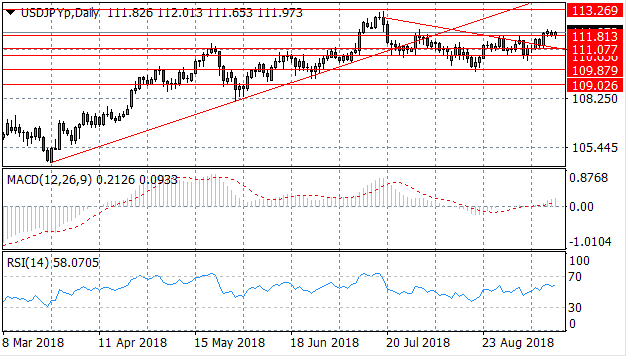
USD/JPY
The USD/JPY pair has failed to clear the 111.81 price level which indicates that this is a significant resistance area for the pair. Momentum indicators are bullish; however RSI is approaching overbought conditions. This may hint to a potential reversal if price action continues to consolidate around the resistance line.
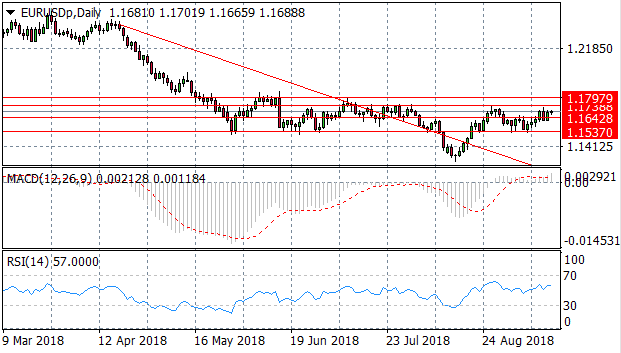
EUR/USD
The EUR/USD pair has broken the 1.164 resistance level and may be headed towards the 1.173 price level, however, the pair has failed to truly test this resistance level in recent trading. Momentum indicators are moderately bullish.
GBP/USD
The GBP/USD pair has finally broken the 1.306 price level to upside and the next target for buyers remains at the 1.330 price level. MACD has broken the zero line and yet RSI is fast approaching overbought conditions. The bullish run may not last.

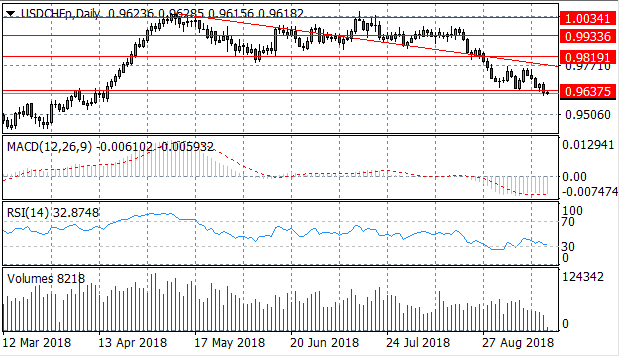
USD/CHF
The USD/CHF pair has broken the key support level at the 0.963 price line, as sellers have returned to the pair with conviction. Momentum indicators are flat- with MACD stalled in bearish and RSI is bouncing along the 30 oversold level.
USD/CAD
The USD/CAD pair is testing the 1.302 price level to the upside, though doji candles represent indecision in the middle of the move. Momentum indicators have flattened in neutral territory.

SILVER
Silver is close approaching the descending trendline which has represented a strong resistance line since May. Each time price action has approached, it has rejected and price action has fallen back to the long-term downtrend. MACD appears to be turning more bullish, however, declining volume may indicate that recent bullish moves may be short-lived.

GOLD
Price action continues to consolidate just below the 1209.70 support level. A series of doji candles indicates indecision from Gold traders. Momentum indicators are neutral if slightly bearish.

OIL
Oil has broken the key 68.84 price level and has tested the ascending trendline. However, the volatility continues, as the commodity sank towards the 68.84 resistance level, once again. A bearish break of the 68.84 price level may send price action toward the 67.32 support level. Momentum indicators are neutral.


