Daily Insights Report 17/07/2017
- 17 Jul 2017
EUR/USD
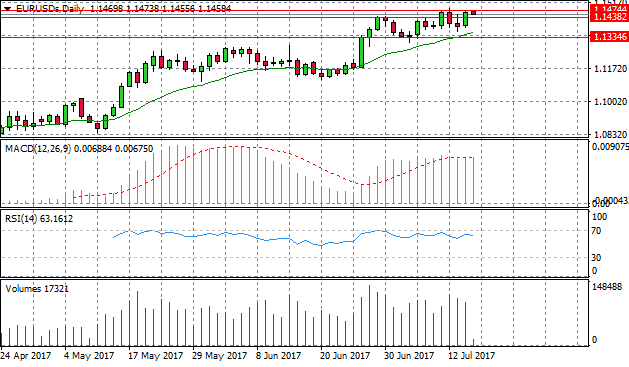
The EUR/USD has hit a market top at the 1.147 price level where the pair has found resistance. This price level represents a previous high over a longer-term horizon and if price action is able to break this line, the bullish move could be sustained in the long-term. The 20-period exponential moving average (EMA) has an upward trajectory and remains below price action. Momentum has turned flat according to MACD despite remaining in positive territory. RSI has bounced off the 70 zone and has a downward trajectory. Volume also appears to be on the decline indicating that the current bullish momentum may not be sustained.
Impact event: Consumer Price Index will be released at 12:00 GMT+3 and could impact all euro pairs.
EUR/GBP
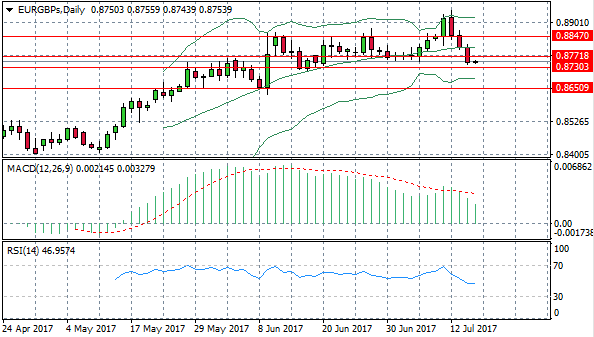
The EUR/GBP pair has bounced off the upper Bollinger band and continued a significant bearish move breaking two resistance levels at the 0.884 price level and 0.877 price level, respectively. Price action has also broken the 20-period EMA. The next price target is the 0.873 price level. However, MACD remains fairly positive although has a bearish trajectory and despite a sharp fall from the 70 zone, RSI has flattened slightly just below the 50 support level.
GOLD
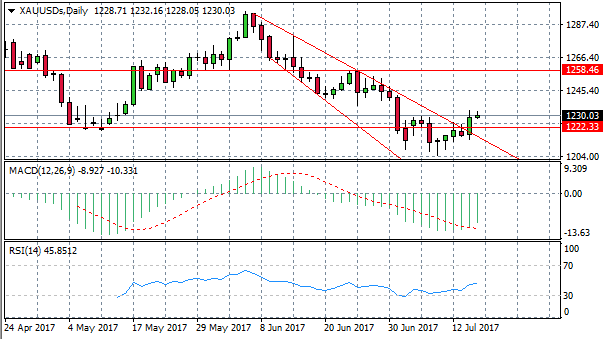
Gold prices have managed to break through both the resistance level at 1222.33 and the upper trend-line after price initially rejected the resistance area. RSI appears to have an upward trajectory supporting the strong bullish move. MACD appears to be stalling below the zero line and has become less negative in recent trading sessions. Whether the move can be sustained will be dependent on the metal’s ability to meet/break the next obvious resistance area at 1242.67. It is possible that the metal will trade in range between the 1222 price level and the 1258 price level.
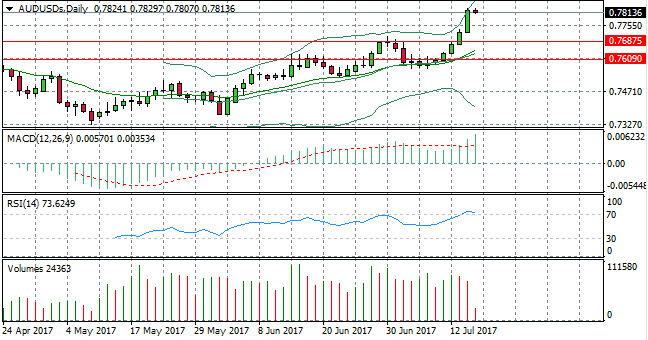
AUD/USD
From the current trading session, it appears that the Aussie Dollar will not reach the 7 consecutive bullish candles to close out a week of bullish moves. The reversal may come sooner. After touching the upper Bollinger band, prices have dropped in the current trading session, indicating less appetite from buyers to continue the move. This is somewhat confirmed by RSI which had moved beyond the 70 level and has now flattened/dipped towards the 70 line. MACD remains in positive territory and the 20-period EMA has an upward trajectory. A close of a bearish candle below the 70 line on RSI would be required to confirm a reversal.