Daily Insights Report 19/07/2017
- 19 Jul 2017
USD/JPY
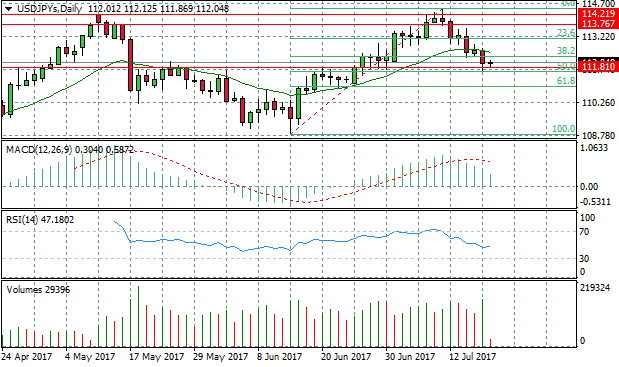
The USD/JPY pair has retraced significantly to break the 20-period exponential moving average. The pair is also testing the 50 Fibo level and a previous resistance line at the 111.81 price level. MACD remains in positive territory although had been declining. RSI has slowed and flattened out on its downward path, stalling at the 50 support line. Volume has risen after a short decline in previous trading sessions. There are signs that a bullish reversal may be imminent as the market reaches exhaustion on the bearish move. Today’s trading session may determine the short-term direction for the pair which will be indicated by whether the pair is able to break the 50 Fibo level or there is a bullish trend change.
Impact event: Housing market data at 12:30 GMT+3 and Japanese Trade Balance data at 23:50 GMT+3 may impact the pair.
GOLD
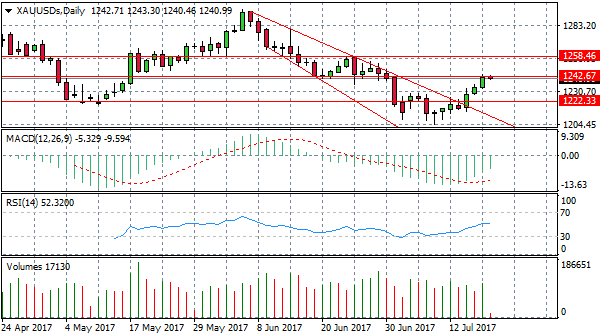
The Gold rally may encounter some resistance as the asset tests the 1242 price level in early trading today. Price action reached but was unable to break the resistance level in yesterday’s trading session. MACD has an upward trajectory- turning less negative, however, RSI has flattened just above the 50 resistance line. Volume had been rising into the bullish move in yesterday’s trading session. A break of the 1242 price level should send prices to the next target at 1258. Given recent dollar weakness, Gold prices could trend higher.
GBP/USD
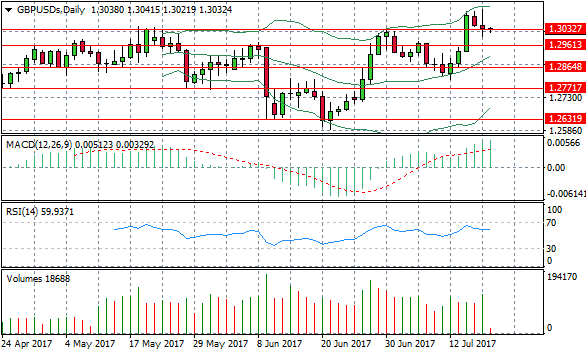
The GBP/USD pair experienced strong selling pressure in yesterday’s trading session, yet the spinning top candlestick into the downtrend indicates some indecision in the market. However, given the fact that the spinning top is near the top of the uptrend it could indicate exhaustion from buyers of the pair. The rise in volume and the long upper shadow also indicate dominance from sellers of the GBP/USD in yesterday’s trading session. A break of the 1.303 resistance line would provide confirmation of the bearish reversal. Momentum indicators are mixed with RSI flattening below the overbought line and MACD remaining positive, however, it is a lagging indicator.
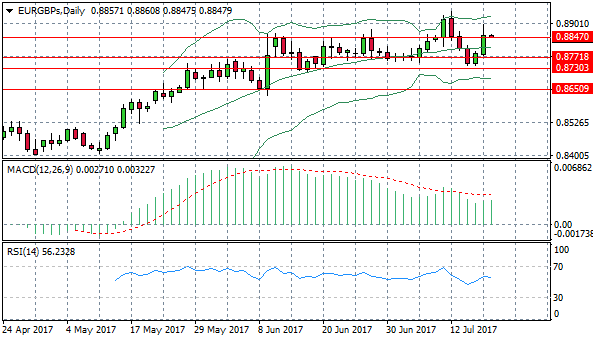
EUR/GBP
The EUR/GBP pair appears to be volatile within the trading range of 0.877 and 0.884. The 0.884 price level appears to be a strong resistance area as price action has only been able to sustain a break of this area once previously after several failed breaks. On the bullish move to break the line, an immediate bearish response followed to bring prices back to the resistance line. It appears price action never moves above the resistance line for long before dropping to meet the 0.884 price level again. There is a good chance that price action will follow the same pattern in the next trading sessions. MACD remains positive but flat and RSI has a downward bias.