Daily Insights Report 21/07/2017
- 21 Jul 2017
EUR/USD
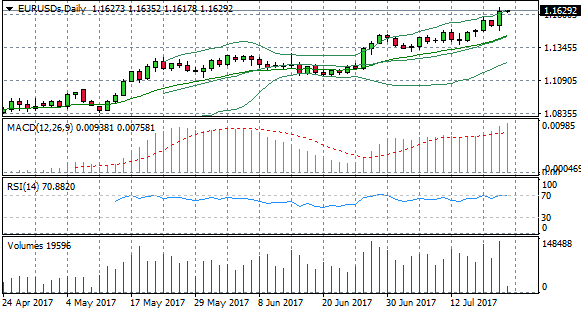
The Euro experienced a significant rally yesterday despite a dovish tone from Mario Draghi at the ECB Press Conference. A surge in optimism has taken MACD into strongly bullish territory. However, the pair is testing the upper Bollinger band and RSI has reached and flattened at the 70 overbought area. Volume had risen into the strong bullish move yesterday as buyers dominated the markets. A reversal seems likely, given the strength in the Euro is not wholly backed up by fundamentals and in part, due to persistent dollar weakness.
EUR/GBP
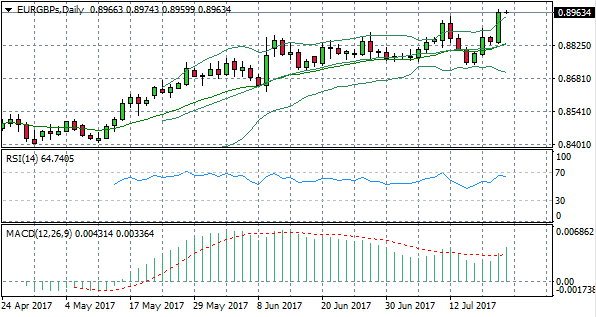
Carrying on the trend of Euro appreciation, the EUR/GBP has also reached overbought conditions. A break of the upper Bollinger band highlights the pair has moved beyond the upper bound of average prices. RSI has stalled at the 70 line and has begun to turn slightly bearish, highlighting sentiment in the pair may have turned more bearish in today’s trading session. MACD has turned strongly positive in the last few bars. Confirmation of the reversal will require a break below the upper Bollinger band coupled with a candle closing below the 70 line.
GBP/USD
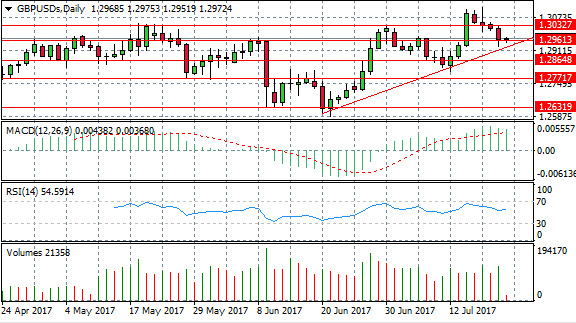
The GBP/USD pair has broken a resistance level at 1.303 and is now testing the 1.296 price level. A break of this line would provide more significance to the retracement. However, the pair appears to be in longer-term uptrend with price action bouncing off the trend-line on two previous occasions. A complete reversal of the previous bullish move would require a break of the trend-line. However if dollar weakness persists, price action may turn bullish again. Pound strength appears to be a result of the prospect of rate hikes given soaring inflation. Therefore fundamental factors are likely to influence the pair in the coming weeks.
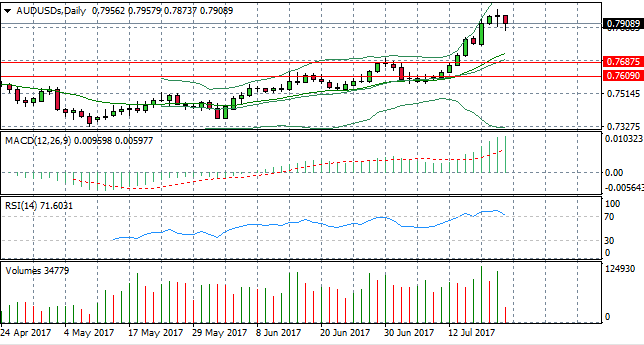
AUD/USD
A candlestick formation on the AUD/USD chart points to bullish sentiment turning to bearish sentiment at the top f the uptrend. After consecutive bullish moves and an extended rally, the pair paused with a doji candle at the top of the trend indicating indecision. This candle has been followed by a bearish belt hold pattern (with no upper shadow and the opening price representing the price high for the day so far). A bearish belt hold pattern is a sign of a bearish reversal; confirmed by RSI, which now has a downward trajectory, moving away from overbought territory. Volume has risen into the bearish move which suggests strong conviction from sellers. Further confirmation of the trend change will come from a close below the 70 line on RSI.