Eurodollar Tests Key Support Level
- 29 Aug 2019
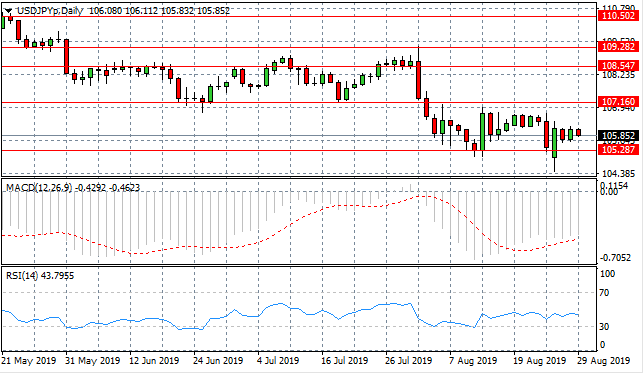
USD/JPY
USD/JPY has rebounded from the 105.28 support level yet sellers are still active in the pair, although price action is moving horizontally. A new trading range between the 105.28 and 107.16 price levels has been established. Momentum indicators remain in strongly bearish territory, with further downside potential.
EUR/USD
The Euro recovery has been reversed with a strong sell-off in recent trading, taking price action back to test the 1.107 price level. On each previous occasion when price action has touched this support level, a bullish reversal has resulted. Momentum indicators remain in bearish territory.

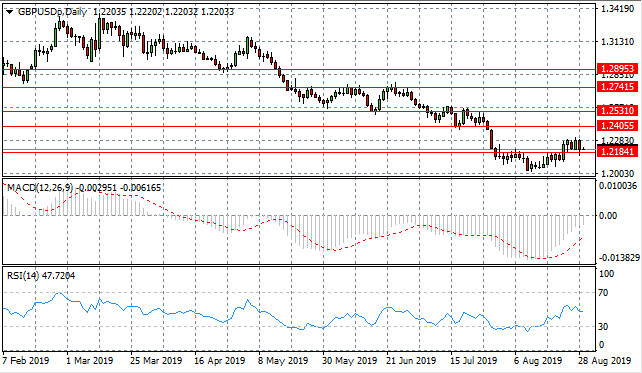
GBP/USD
The GBP/USD pair has broken the 1.218 resistance line, however, this has inspired the return of sellers. A trading range between the 1.218 and 1.240 price levels may be established. Momentum indicators have turned more bullish with MACD approaching the zero line and RSI breaking through the default line.
USD/CHF
The USD/CHF pair has found support and is now testing the 0.981 resistance line with a break indicating that the pair could move into a new trading range. The overall trend is downward for the pair with the occasional bullish rebound in price action. Momentum indicators are neutral if slightly bearish.

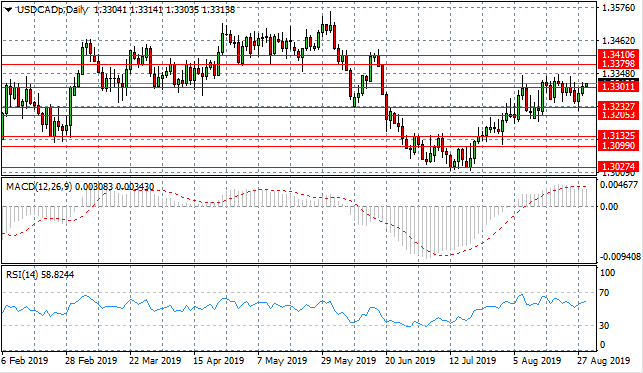
USD/CAD
The USD/CAD pair is once again testing the 1.330 resistance level which on previous occasions, has resulted in the return of sellers, as the pair struggles to move beyond the resistance area. A break may take the pair to resume the previous uptrend. Momentum indicators are bullish with further upside potential.
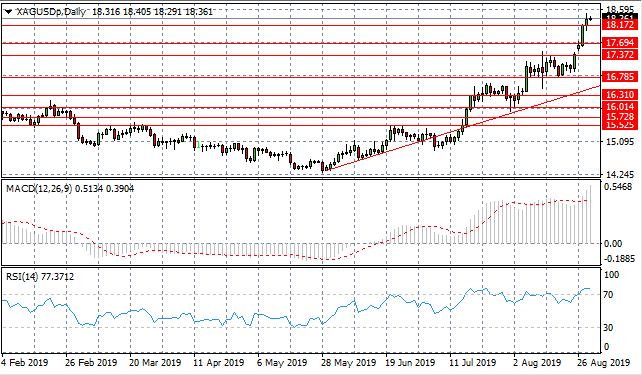
SILVER
Silver has broken the 18.17 resistance line in a strong bullish move. The fact that price action has extended beyond this two year high, is significant especially given the strength of the rally. The break has resulted in some slowdown in momentum. MACD has extended further into bullish territory and RSI has moved beyond overbought conditions.
GOLD
Gold continues to test the ascending trendline with bullish price action spiking the trendline but not breaking the trendline. There are signs of exhaustion in the rally represented by a series of pullbacks, where the rally starts to become shallower. Momentum indicators are strongly bullish with RSI reaching overbought conditions.

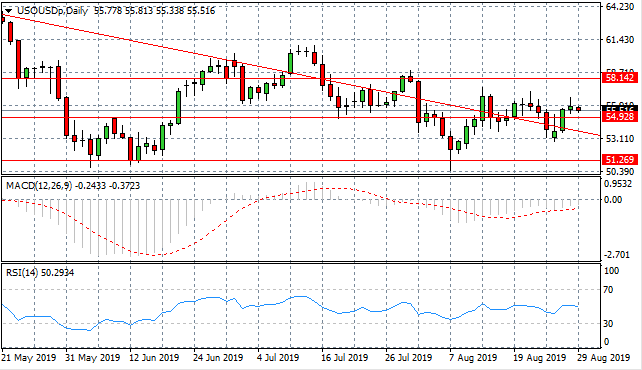
OIL
WTI has broken both the 54.92 support level and the descending trendline, with strong bullish moves, yet a resistance level exists at the $55 per barrel range. Price action continues to track the descending trendline. Momentum indicators are neutral if slightly bearish.