GBP/USD Pair Touches Recent Price Low
- 31 Oct 2018
Unlock the secret strategy of gold trading. Trade like a PRO today! Reserve your seat for a FREE Gold Trading webinar today!
USD/JPY
The USD/JPY pair has bounced back from the 111.81 support level after buyers returned to the pair. As a result, the pair is testing the 113.26 price level. Momentum indicators have turned bullish, with MACD has halted at zero line and RSI has an upward trajectory.

EUR/USD
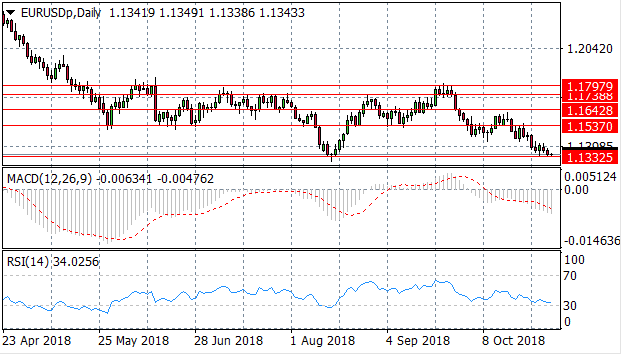
The EUR/USD pair is approaching a strong support level at the 1.133 price line and once again several doji candles indicate that momentum has begun to stall. Each time the pair has approached this support area price action has experienced a bullish retracement. Momentum indicators remain bearish with MACD extending its position below the zero line and RSI has hit oversold conditions at the 30 support level.
Impact event: Eurozone CPI data will be released at 10:00 GMT and will impact all Euro pairs.
GBP/USD
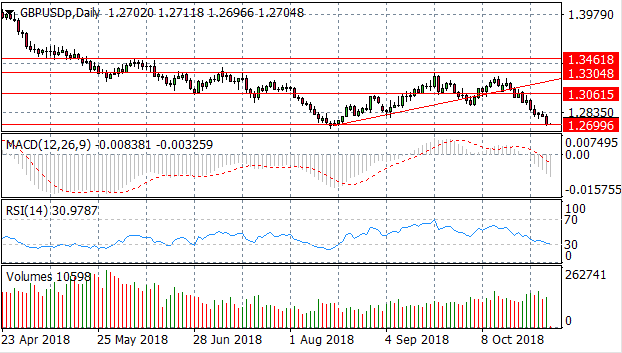
Bearish momentum has sent the GBP/USD pair towards the 1.269 price level which represents a recent price low. Sellers have returned to push price action towards the support area. Momentum indicators are bearish; MACD has extended its bearish position and RSI has hit the 30 support area.
USD/CHF
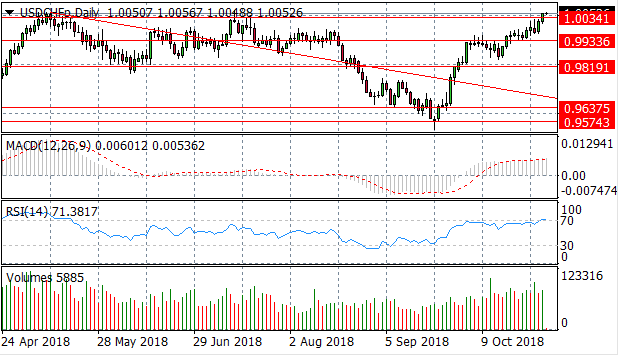
The USD/CHF pair has broken a key resistance area at the 1.003 price level which has represented a recent price high on several occasions. MACD has flattened in bullish territory and RSI has hit overbought conditions which may suggest that a reversal is imminent.
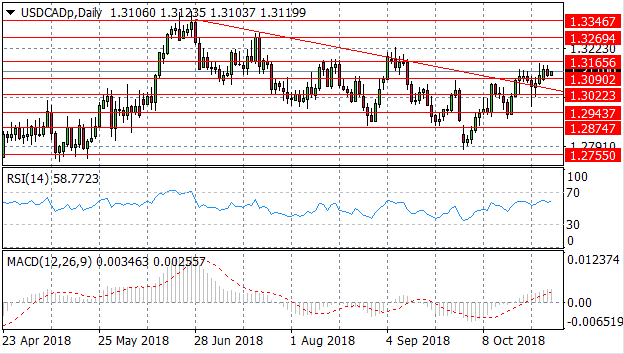
USD/CAD
The USD/CAD has been volatile in recent trading in response to a volatile oil market. A break of the descending trendline could send price action to the 1.316 price level as an ascending channel begins to develop. A break of the zero line on MACD and the upward trajectory of the RSI indicates the bullish momentum is well supported.
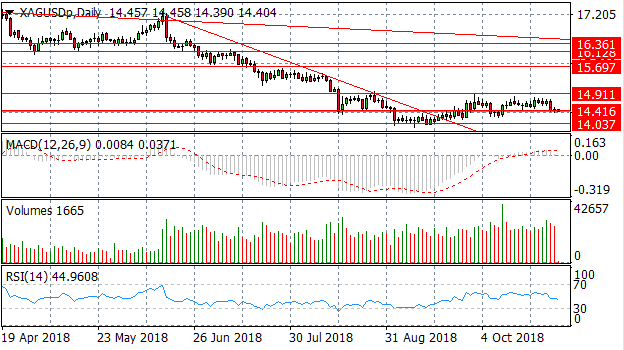
SILVER
Silver has once again stalled at the 14.41 price level after a strong bearish move in recent trading. A new price range has developed between the 14.41 and 14.91 price levels. MACD has just broken the zero line and RSI is bearish.
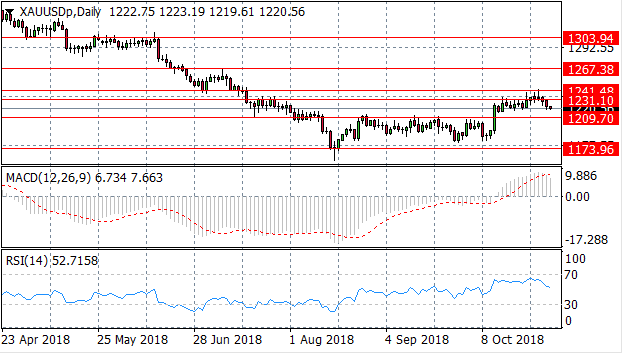
GOLD
Gold has fallen back after breaking the 1231.10 price level and this price line appears to be a key resistance level. Momentum indicators appear to be retracing from bullish positions; MACD appears to be undergoing a momentum reversal and RSI is pulling away from overbought conditions.
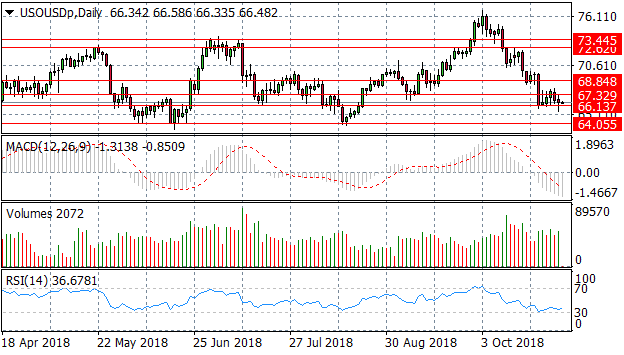
OIL
Oil price has fallen back from the 67.32 price level and buyers appear to have returned to the pair. However, the pair appears to be in a descending flag pattern indicating the long-term trend is bearish. Momentum indicators remain bearish; with MACD breaking the zero line and RSI stalling at the 30 support line.