Has Gold Reached The End Of A Bullish Run?
- 4 Sep 2017
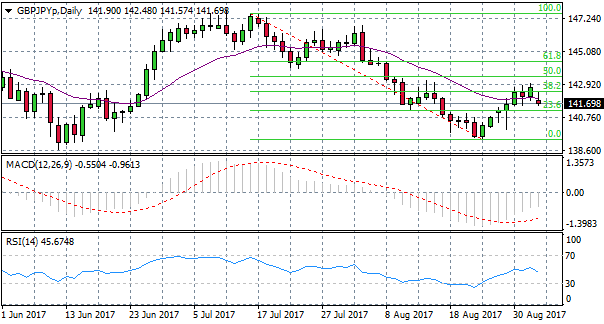
GBP/JPY
After a bullish retracement for the GBP/JPY pair, a bearish reversal appears to be underway. The pair rejected the 38.2 Fibo level and has crossed the 20-period EMA with increased selling pressure. MACD remains below the zero line although is becoming less negative and RSI has a sharp downward trajectory. The likelihood is that price action continues to resume the previous downtrend.
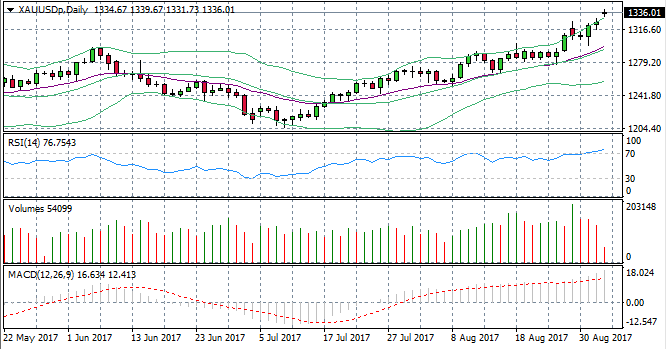
GOLD
Gold prices have reached a near-term market top with a break of upper Bollinger band. A doji candle to signal the break indicates that current bullish momentum may not be sustained. Volume has also been declining in recent trading sessions suggesting less conviction from buyers. RSI has broken the 70 overbought line, however MACD remains in positive territory. A bearish reversal seems likely and will be confirmed by a bearish candle closing below the 70 line on RSI.
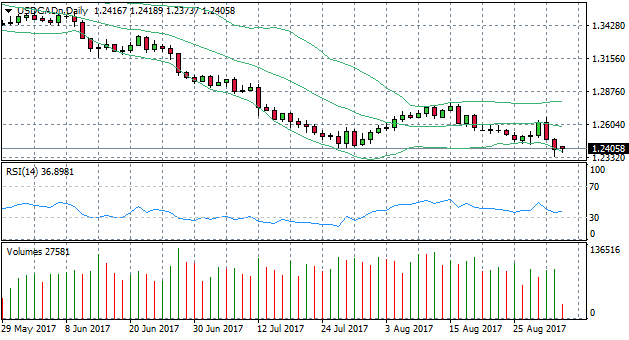
USD/CAD
The USD/CAD daily chart indicates that there is a potential bullish reversal in the near-term. Several breaks of the lower Bollinger band suggests the pair has reached a statistical extreme. RSI has an upward trajectory which is divergent from price action. A trend change is signaled. Volume remains steady.
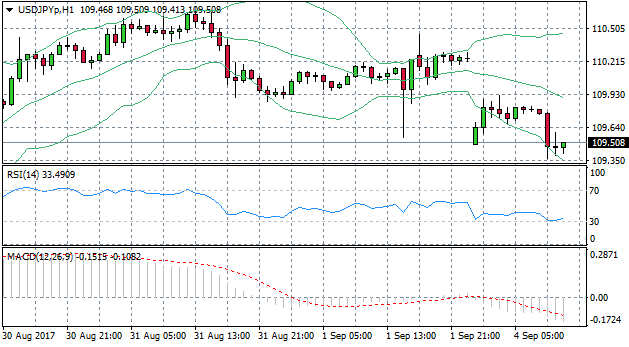
USD/JPY
The Dollaryen hourly chart also indicates a trend change as price action turns bullish after having broken the lower Bollinger band. A doji candle signaled the trend change followed by a bullish candle. RSI has also turned in a more positive direction hitting the 30 oversold line and bouncing back. A candle closing above the 30 line will confirm the uptrend.