USD/CHF Approaches Key Resistance Area
- 2 Sep 2019
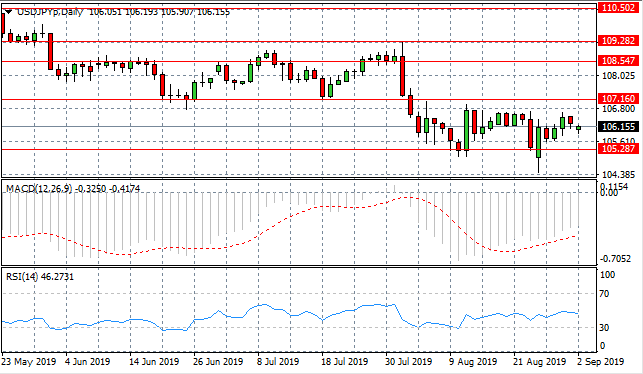
USD/JPY
The USD/JPY pair is oscillating between the 105.28 and the 107.16 price levels which has developed as a new trading range for the pair. Horizontal trading within this range will likely to continue until some fundamental news influences price action. Momentum indicators remain in bearish territory but are beginning upward trajectories.
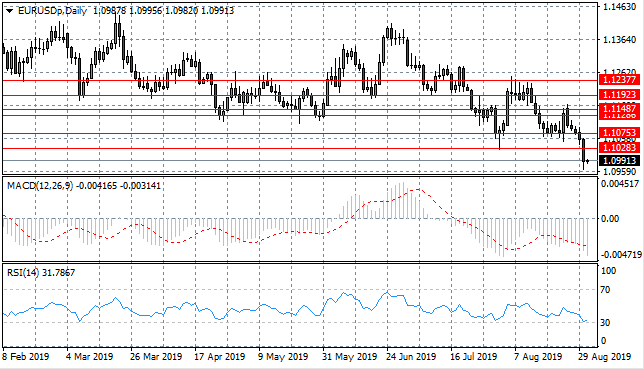
EUR/USD
The Euro continues to suffer from a strong sell-off in recent trading, taking price action to break the 1.102 price level; reaching a multi-year low. A longer-term downtrend appears to have been established for the pair. Momentum indicators remain in bearish territory, however, RSI has reached oversold conditions.
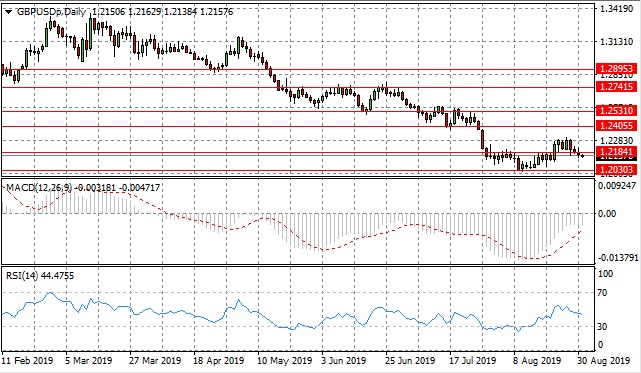
GBP/USD
The GBP/USD pair continues to test the 1.218 resistance line and a moderate break may take price action towards the 1.203 support level. A series of doji candles indicate some lack of conviction from sellers. Momentum indicators are bearish however MACD is approaching the zero line and RSI has entered into the selling channel.
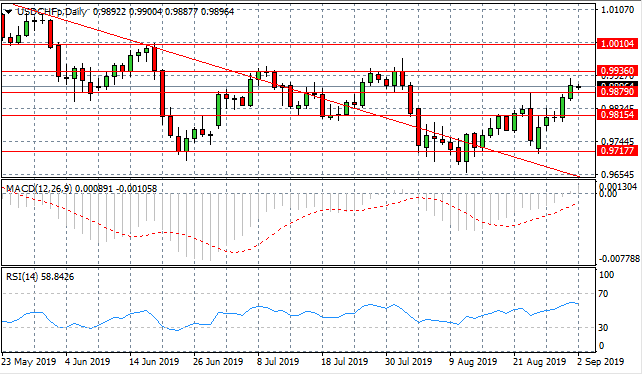
USD/CHF
The USD/CHF pair has broken the 0.987 resistance line with the next resistance line at the 0.993 price level. The last six consecutive trading sessions have been bullish, however, a strong resistance area remains at the 0.993 price line. Momentum indicators have an upward trajectory with MACD verging on a bullish break of the zero line and RSI moving into the bullish channel.
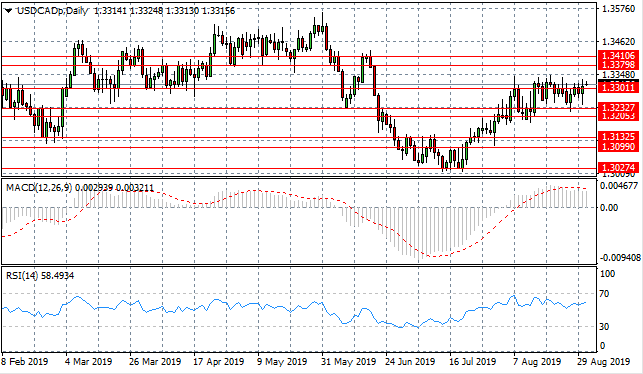
USD/CAD
The USD/CAD pair is unable to clear the hurdle of the 1.330 price level as selling pressure rises each time a break is attempted. Horizontal trading will likely continue until significant fundamental factors take hold. Momentum indicators are bullish with further upside potential.
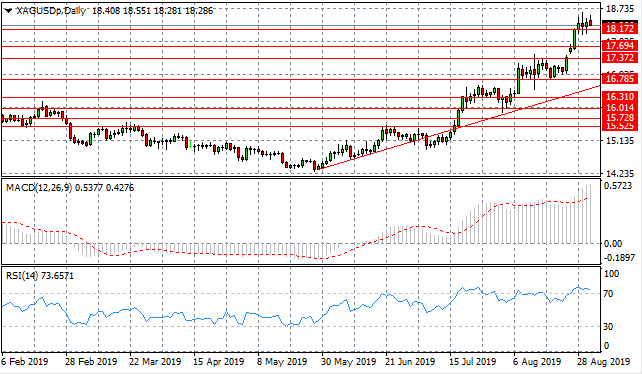
SILVER
Silver has broken the 18.17 resistance line in a strong bullish move. However, the break has been met with rising selling pressure which may be the first indication of a potential reversal. MACD has extended further into bullish territory, however, RSI has reverted back towards the 70 overbought line, as another sign of a potential reversal.
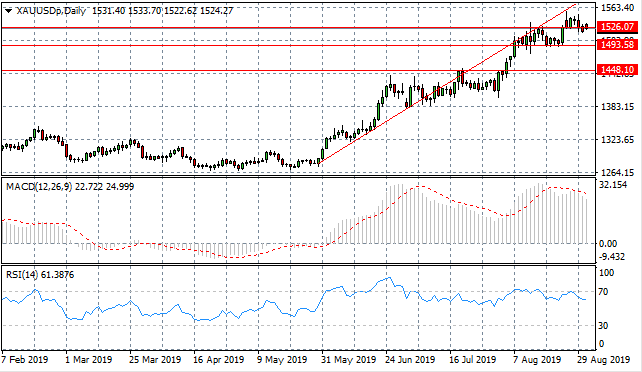
GOLD
Gold also appears to be pulling back from the extended rally and is no longer testing the ascending trendline, rather, is testing the 1526.07 support level. These signs of exhaustion in the rally may represent the end of the longer-term bullish sentiment. Momentum indicators are also pulling back from bullish territory as reversals appear to be underway.
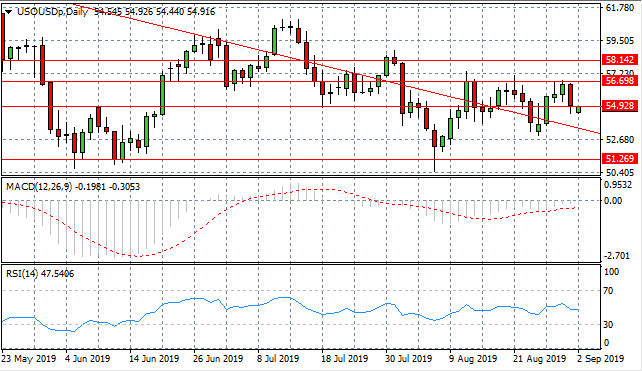
OIL
WTI is testing the 54.92 resistance line after rejecting the 56.69 resistance line in a strong bearish move. Buyers have returned since the break of the 54.92 price level. Therefore, the long-term bearish trajectory of the commodity will likely remain intact. Momentum indicators are neutral if slightly bearish.