USD/JPY Enters Symmetrical Triangle Pattern
- 7 Dec 2018
USD/JPY
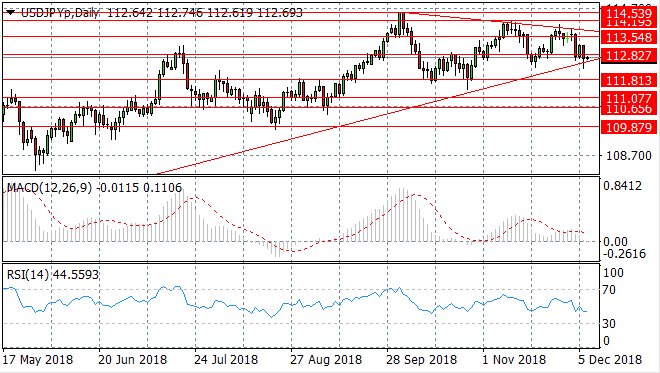
The USD/JPY pair has entered into a symmetrical triangle pattern and is testing the lower trendline. Near-term direction for the pair will be determined by whether price action breaks or rebounds from the trendline. Momentum indicators are bearish with downward trajectories with RSI fast approaching oversold conditions.
Impact event: The NFP report will be released at 15:30 GMT+2 and will impact all USD pairs.
EUR/USD
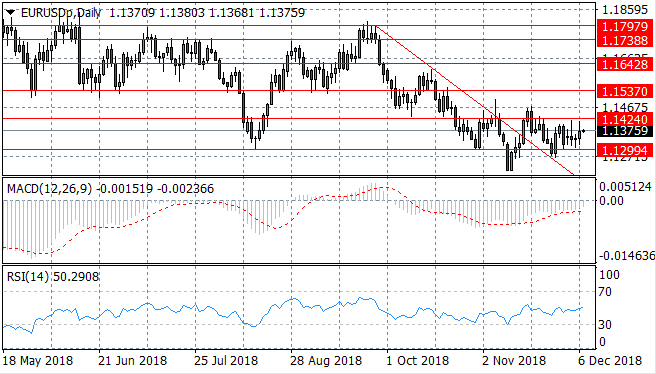
The EUR/USD pair has rebounded from the descending trendline once again indicating that this may be a new support area for the pair. A series of doji candles do indicate indecision and the pair may consolidate between the 1.129 and 1.142 price levels, in the near term. Momentum indicators have turned neutral if slightly bearish which is consistent with price action consolidating.
GBP/USD
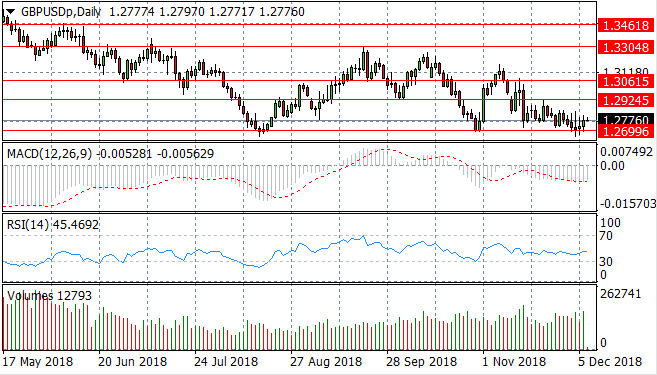
Fundamental factors influenced the recent sell-off in the GBP/USD pair and these factors continue to put pressure on the Pound. The pair has rebounded from the 1.269 price level which remains the floor of a recent trading range. Momentum indicators are moderately bearish with MACD remaining below the zero line and RSI flattening just above the 30 level.
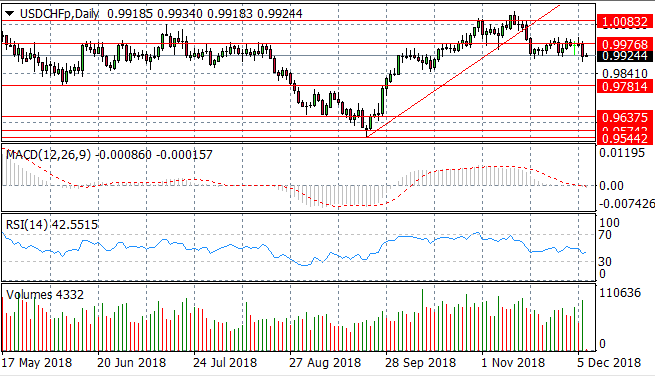
USD/CHF
The 0.997 price level appears to be a sticking point for the USD/CHF pair, however, the pair is approaching a recent resistance area at the 0.992 price level after a bearish move. If there is any slight bias in momentum, it would be bearish. MACD is approaching the zero line and RSI remains in neutral if slightly bearish territory.
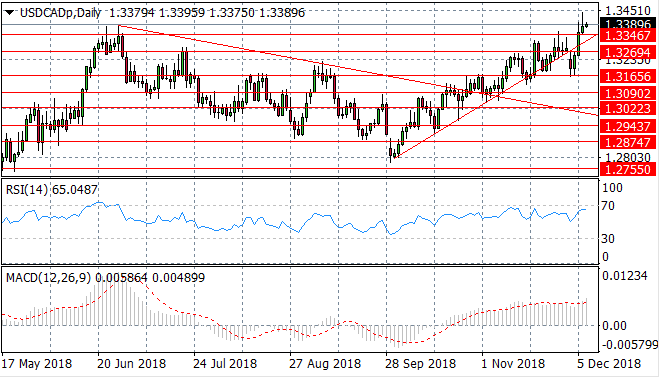
USD/CAD
The USD/CAD pair has broken the ascending trendline and the 1.334 price level which represents a previous price high. It appears the sharp uptrend has resumed as buyers have aggressively returned to the pair. There was a rise in selling pressure in yesterday’s trading which may signal the end of the rally. Momentum indicators are bullish, with RSI approaching overbought conditions.
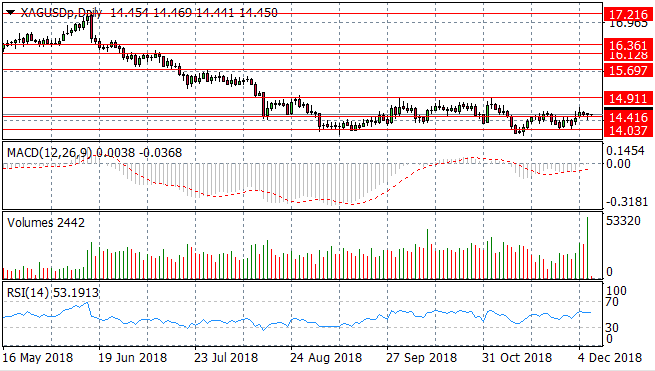
SILVER
Silver has rebounded from the 14.03 price level to maintain a recent trading range between the 14.03 and 14.91 price levels. Buyers have returned to the metal to break the 14.41 price level. Momentum indicators have turned bullish and volume has climbed into the move.
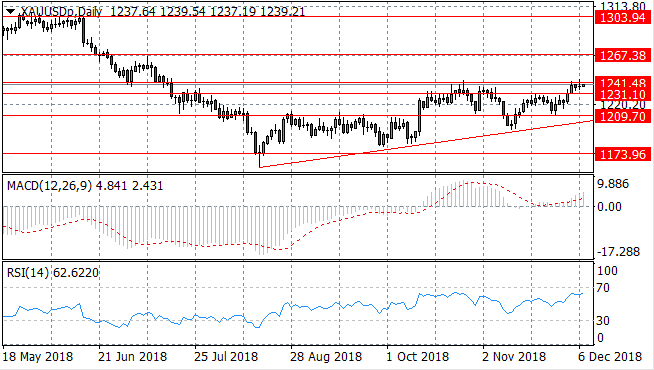
GOLD
Gold has once again undergone a bullish retracement from the ascending trendline to break the 1231.10 price level and is now testing the 1241.48 price level. This price level, however, is a strong resistance area for the pair which has seen price action unable to break on several previous occasions. Momentum indicators appear to be turning sharply bullish, with RSI approaching the 70 resistance area.
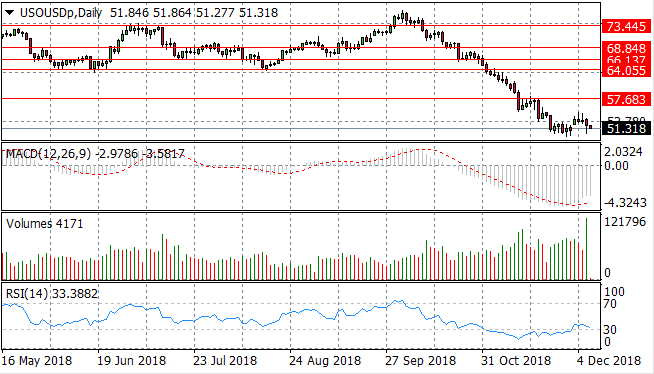
OIL
Oil appears to have broken a descending flag pattern, with price action appearing to make a mild recovery after an extended sell-off. The recovery appears to be slowing and sellers are very much still active as denoted by the falling price and rising volume. MACD appears to be undergoing a momentum reversal and RSI continues to bounce around the 30 support level.