Can The Eurodollar Break Out Of The Long-term Bearish Bias?
- 23 Nov 2018
USD/JPY
The recent pullback for the USD/JPY pair appears to have been short-lived. Price action has returned to break the 112.82 price level. Momentum indicators reflect the pullback in price action; with MACD approaching the zero line to the downside however, RSI has hit the default line which suggests a slowdown in bearish momentum.

EUR/USD
The EUR/USD pair suffered another mild sell-off in recent trading which has resulted in the pair falling back below the 1.142 price level. MACD is heading towards the zero line indicating and RSI has an upward trajectory indicating that momentum has turned bullish.

GBP/USD
Fundamental factors influenced the recent sell-off in the GBP/USD pair and these factors continue to put pressure on the Pound. Buyers are continuing the fight which saw price action test the 1.292 price level in yesterday’s trading. Momentum indicators appear to be reversing, with MACD returning towards the zero line and RSI is bouncing back from the 30 support level.

USD/CHF
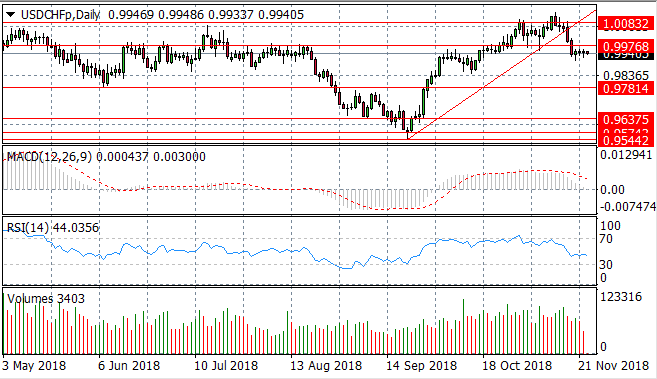
The USD/CHF pair has broken the 0.997 price level to the downside which appears to have inspired buyers to return to the pair. A series of doji candles indicates indecision as neither buyers nor sellers have the conviction to drive price action. Momentum indicators are bearish with MACD approaching the zero line and RSI approaching the 30 support level.
USD/CAD
The USD/CAD seemed indeed to be overbought which inspired sellers to push the pair back below the 1.326 price level. The pair is once again approaching the ascending trendline and the next target is therefore the 1.326 price level. Momentum indicators appear to be turning more bearish with RSI pulling back from the 70 resistance level and MACD decelerating in bullish territory.
Impact event: Canadian CPI data will be released at 13:30 GMT and will impact all CAD pairs.

SILVER
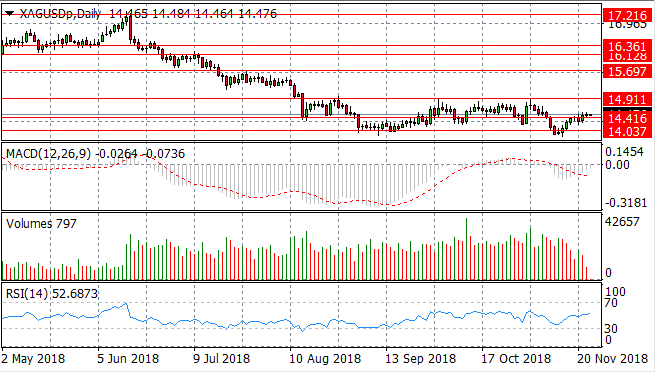
Silver has rebounded from the 14.03 price level to maintain a recent trading range between the 14.03 and 14.91 price levels. The metal has now broken the 14.41 price level. A series of doji candles indicate neither buyers or sellers are dominating the commodity therefore it will likely consolidate within range.
GOLD
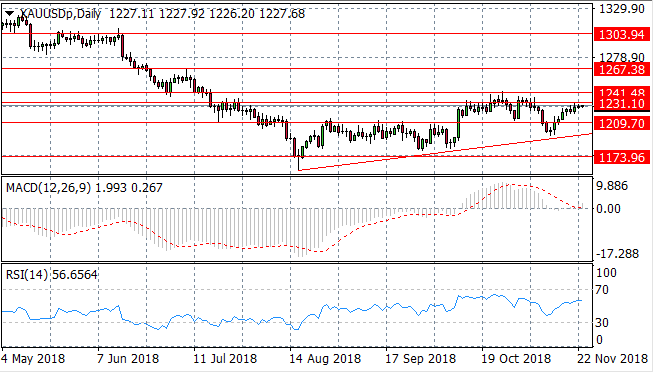
Gold has once again undergone a bullish retracement from the ascending trendline at the 1191.58 price level and as a result, is testing the 1231.10 price level. Momentum indicators are mixed with MACD touching the zero line and RSI pulling breaking the 50 default line. Given the struggle metal has had to break this resistance level, price action will be more likely to head back towards the ascending trendline.
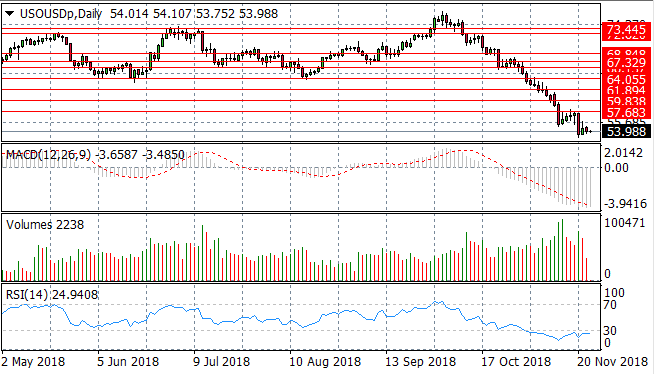
OIL
Oil appears to have entered into a descending flag pattern, with price action making small retracements followed by strong bearish sell-offs. MACD has flattened in bearish territory and RSI continues to bounce along just beneath the 30 support level. Volume has dropped off indicating a pause before another potential sell-off.