Daily Insights Report 10/07/2017
- 10 Jul 2017
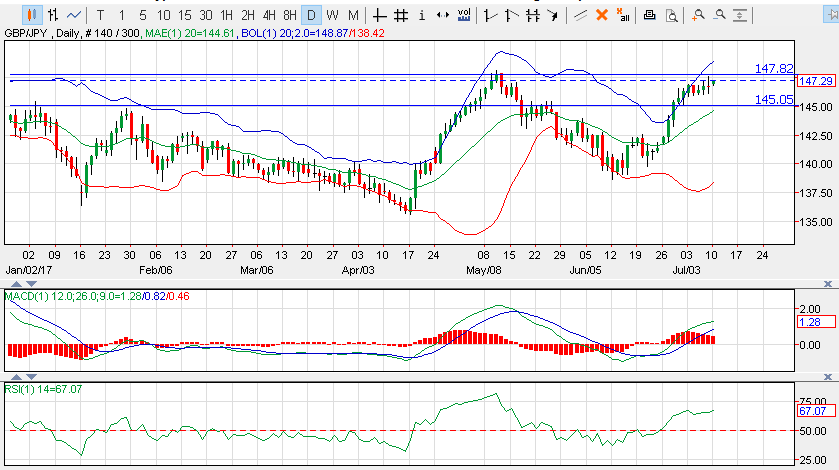
GBP/JPY
Broad weakness in the Japanese Yen has allowed major peers to gain ground on the Yen in the last month. Sterling has appreciated against the Yen, but the question is: how long can the bullish momentum continue? The pair is approaching a significant resistance area at 147.82, having broken the 145.05 price level. Price bounced back from the 147.82 on a previous occasion and this could provide a point of exhaustion for Pound buyers. RSI is reaching overbought territory and MACD has started to decelerate, with the histogram heading towards the zero line.
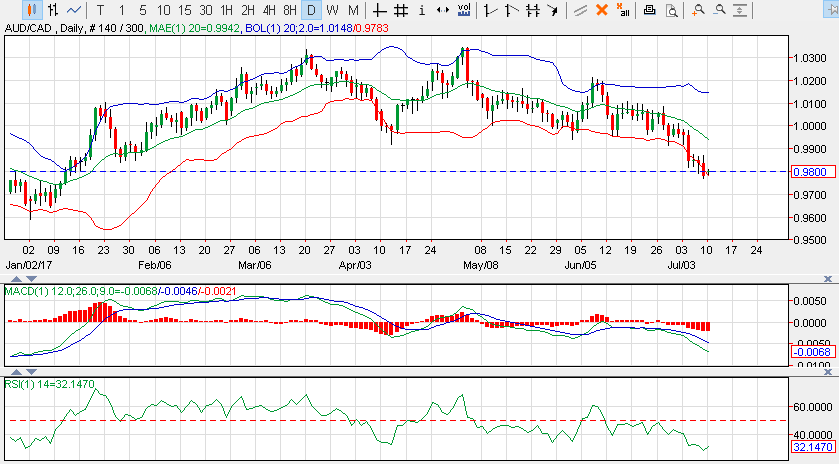
AUD/CAD
One currency that has not managed to gain ground over the Japanese Yen, however, is the Australian Dollar. The AUD/CAD pair has broken the lower Bollinger band on four consecutive occasions which has then been followed by a bullish candle in the current trading session. RSI has bounced off the 30 support level with a sharp upward trajectory. The next candle to close above the 30 support level indicates a potential reversal. MACD does not appear to support a bullish reversal currently and remains in negative territory.
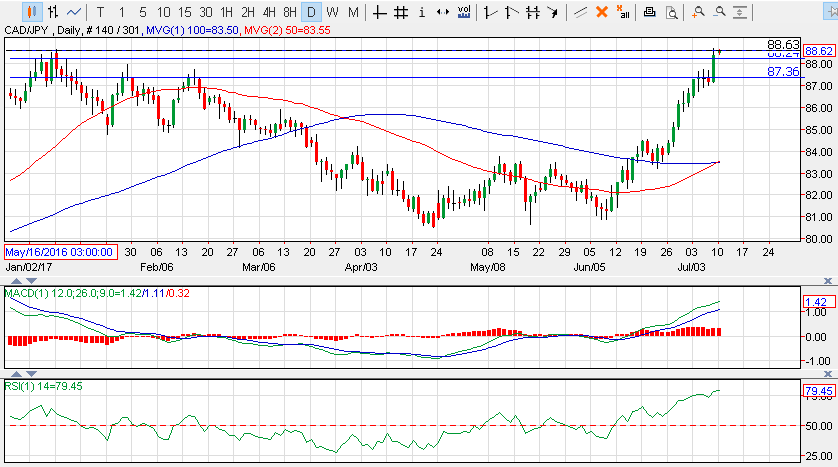
CAD/JPY
The theme of Japanese Yen weakness continues with the CAD/JPY pair, with the Canadian Dollar making significant ground on the yen since the beginning of June. Price action has hit a previous market top at the 88.24 price level. RSI also indicates the pair is strongly overbought. However a bullish crossover of the 50-period over the 100-period moving average suggests that buying momentum may continue in the short term. If the pair is able to break the 88.24 price level, a new ‘top’ is likely to be made. Both MACD and RSI have strong upward trajectories and MACD has divergence from the signal line.
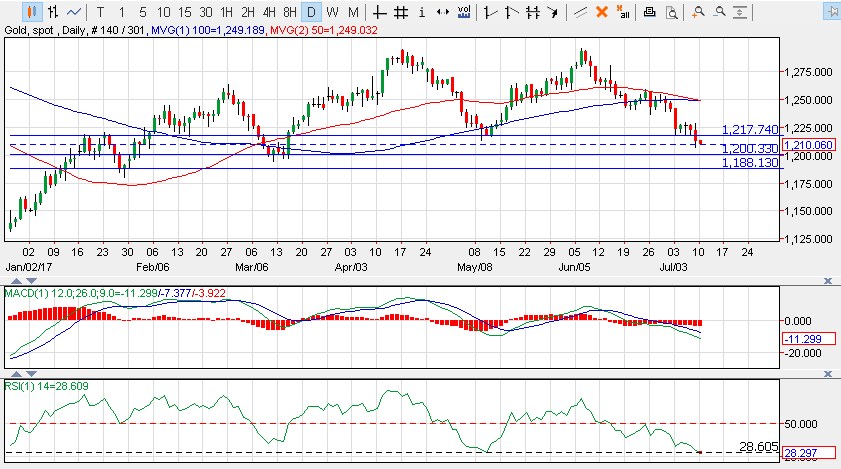
GOLD
A bearish crossover of the 50-period moving average over the 100-period moving average indicates that near-term momentum is bearish for Gold. Price action has broken a previous support level at 1,217.74 and is heading towards the 1,200.33 level. MACD has broken the zero line with a bearish trajectory coupled with MACD-signal line divergence. RSI indicates that the metal is now oversold at the 28.65 level however, the indicator has a sharp downward trajectory with lower lows and lower highs.