Gold and The Euro Pare Gains From Yesterday’s Trading Session
- 30 Aug 2017
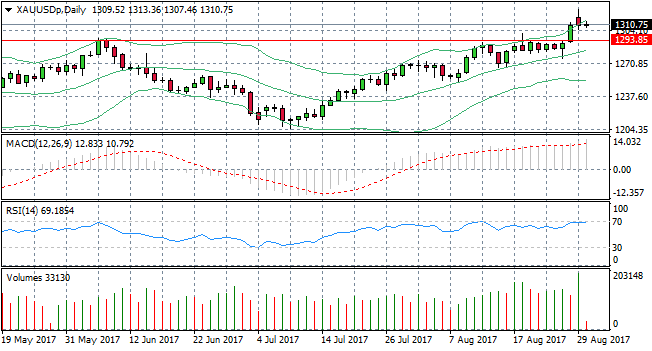
GOLD
A break of the upper Bollinger band on the Gold daily chart indicates a potential bearish reversal. The bearish candlestick at the top of the market in yesterday’s trading session signifies strong selling pressure (long upper shadow). RSI has hit the 70 overbought line and volume has risen significantly into the move. The next price target is therefore the 1293.85 price level.
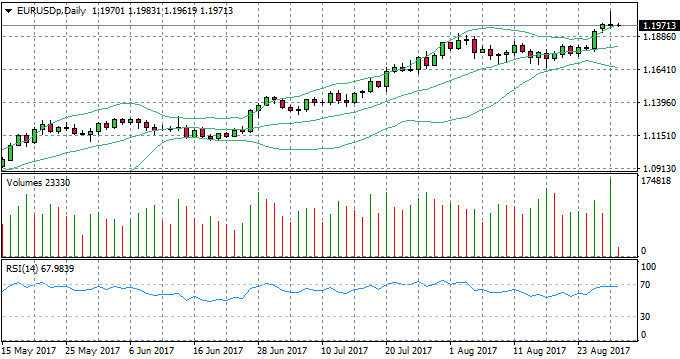
EUR/USD
Unsurprisingly, the daily chart for the EUR/USD is somewhat a mirror image of the daily Gold chart. Similarly, consecutive breaks of the upper Bollinger band signify a potential bearish reversal. A long-shadowed candlestick at the market top yesterday indicates heavy selling of the Euro. Volume has risen sharply and RSI has flattened at the zero line.
Impact event: ADP Payroll data will be released at 15:15 GMT+3 and U.S. GDP data will be released at 16:30 GMT+3 and will impact all dollar pairs.
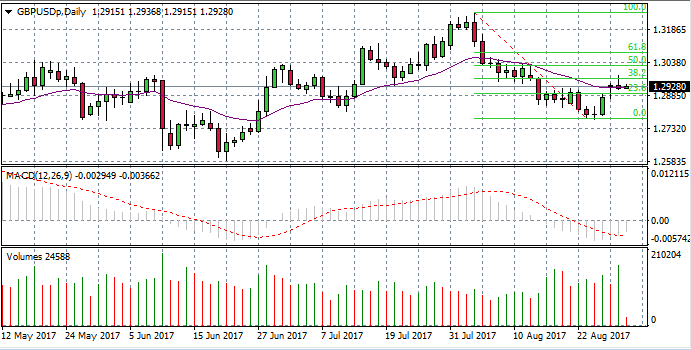
GBP/USD
The GBP/USD daily chart indicates that there is a potential bearish reversal after prices retraced towards the 38.2 Fibo level. The pair has found resistance at this level and the 20-period EMA is also acting as a resistance level. MACD is showing that sentiment is bearish however, the indicator appears to be turning more positive. Volume is rising indicating an increase in interest in the pair and a potential breakout.
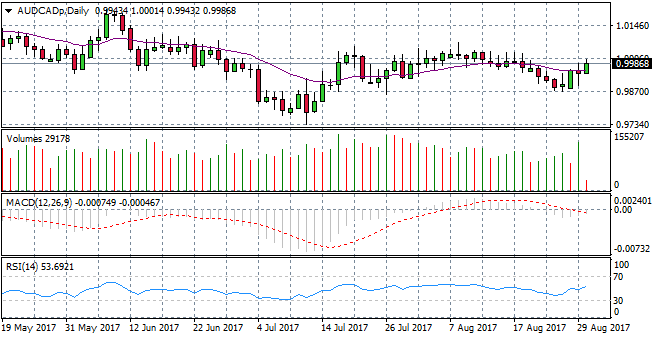
AUD/CAD
The AUD/CAD has broken the 20-period EMA to the upside with rising volume into the move. MACD has hit the zero line and confirmation of the uptrend will come from a break of the zero line to the upside. RSI has an upward trajectory.
Impact event: Canada Current Account data for Q2 will be released at 15:30 GMT+3 and will impact the Canadian dollar.