Will Crude Oil Inventories Provide Support To The Canadian Dollar?
- 31 Aug 2017
USD/CAD
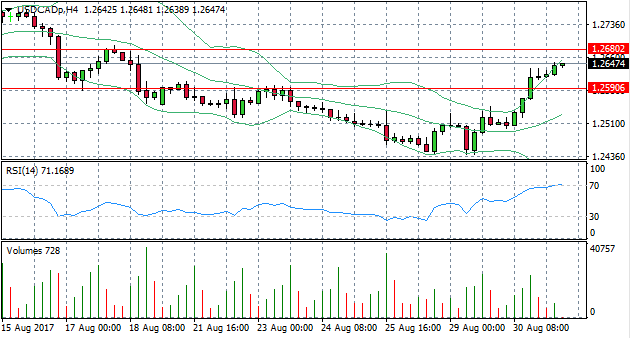
Consecutive breaks of upper Bollinger band on the 4-hour chart suggests that the USD/CAD pair is becoming overbought. Overbought conditions are also confirmed by RSI which has hit the 70 overbought zone and flattened. Volume has also been declining significantly suggesting that US Dollar buyers may be losing steam. Price action may continue to the 1.268 price level but appears more likely to drop down towards the 1.259 price area.
Impact event: Crude Oil Inventories data will be released at 17:30 GMT+3 and will impact the Canadian dollar.
NZD/USD
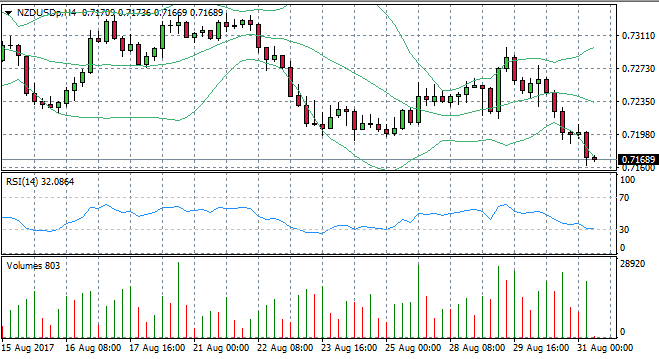
On the 4-hour chart, the NZD/USD pair has broken the lower Bollinger band for the last four of five candles. As confirmation, RSI has hit the 30 support level. Volume appears to be climbing for the pair, indicating rising interest. A bullish reversal will be indicated by a bullish candle closing above the 30 line on RSI.
GOLD
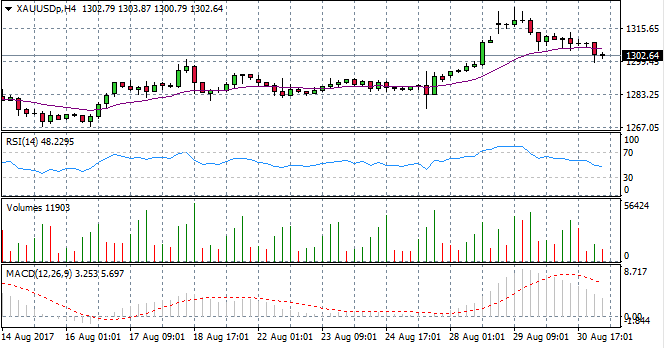
A break of the 20-period EMA on the 4-hour Gold chart suggests prices may be moving lower in today’s trading session. Momentum indicators; RSI and MACD both have downward trajectories despite MACD remaining above the zero line. Confirmation of the break lower will require MACD to cross the zero line, where a downtrend is confirmed. Volume is low.
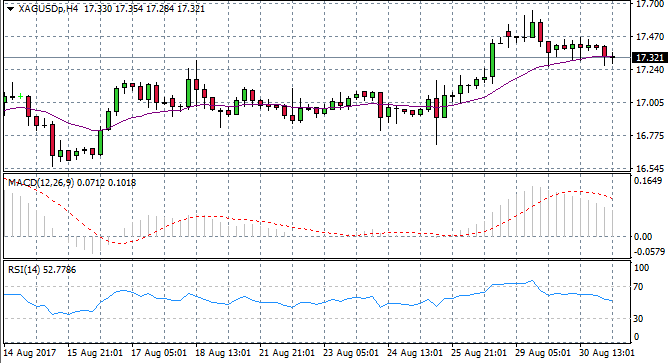
SILVER
To mimic the Gold chart, Silver prices have turned more bearish in recent trading sessions with the 20-period EMA providing support for the metal. A full break (a close below the EMA) will provide weight to the downtrend. Bearish sentiment is confirmed by MACD which has turned sharply toward the zero line and RSI has a moderate downward trajectory. Fundamental factors are more likely to impact Silver prices.