U.S. Dollar Weak Against Major Peers
- 29 Aug 2017
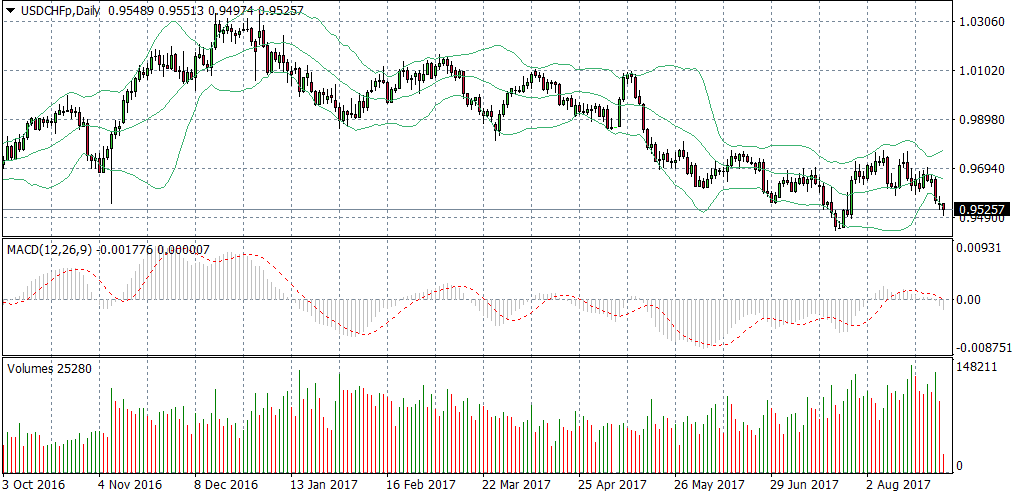
USD/CHF
A break of the lower Bollinger band on the USD/CHF daily chart indicates near-term bearish momentum. Confirmation of the momentum is provided by MACD which has also broken the zero line to the downside. A spike in volume to start the move indicates there is conviction from Swiss Franc buyers to start today’s trading session.
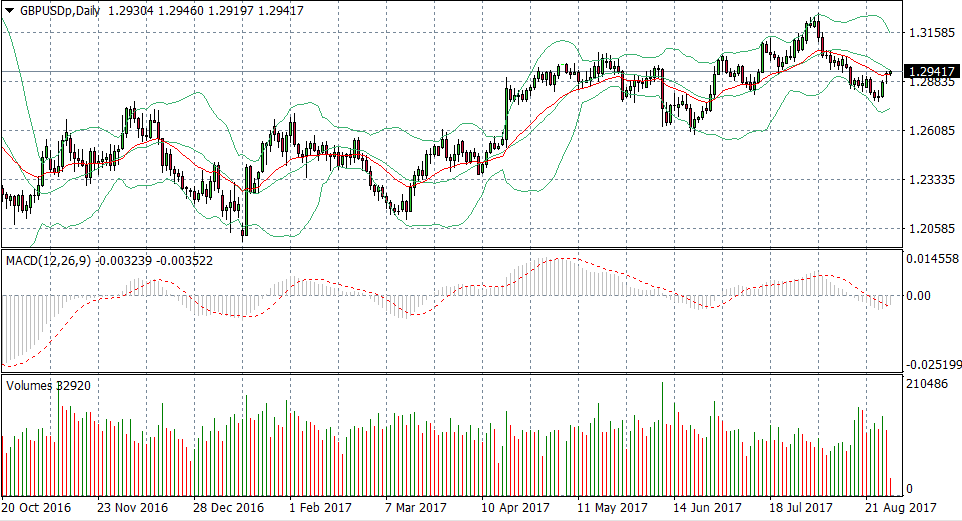
GBP/USD
The British Pound appears to be making a come back against the U.S. Dollar with a break of the 20-period EMA on the daily chart. There is still confirmation required from momentum indicators to provide weight to the bullish move. MACD remains in negative territory however, is moving towards the zero line. A break of the zero line would indicate the uptrend will continue in the near-term. Rising volume indicates increasing interest in the pair.
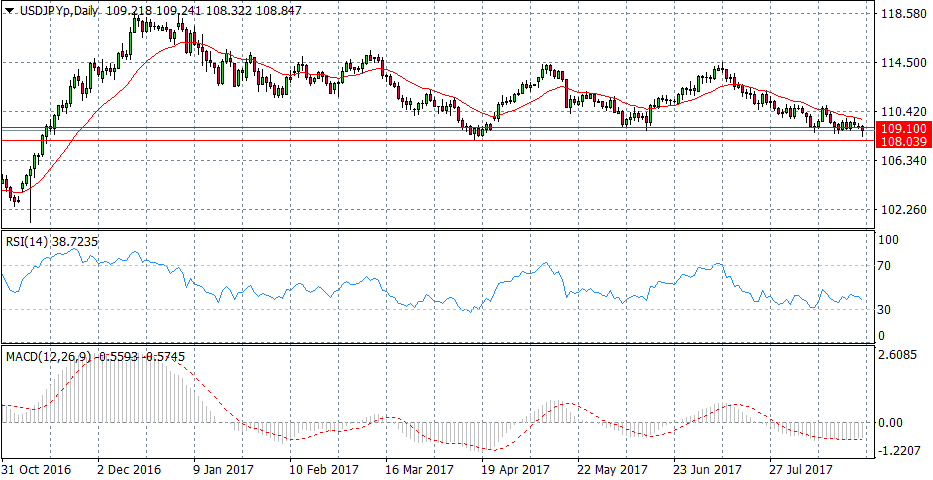
USD/JPY
The USD/JPY daily chart indicates that there is a potential bullish reversal in the near-term. Price action has broken through the 109.10 price level and is approaching a strong support area at the 108.03 price level. A touch of this price level on previous occasions has resulted in a bullish reversal. RSI is also approaching the 30 ‘oversold’ line. MACD remains flat below the zero line. The future direction for the pair will be determined by whether price action hits the 108.03 price level.
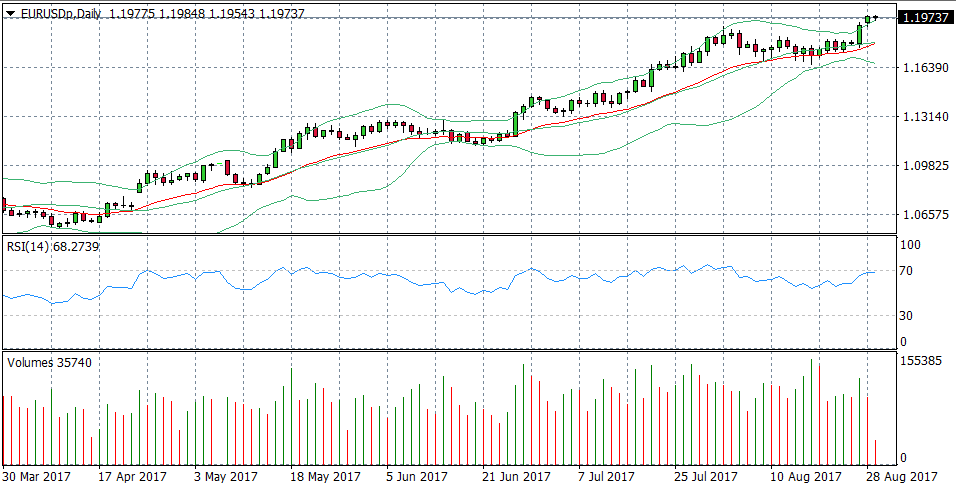
EUR/USD
The Euro continues its surge higher, taking advantage of Dollar weakness. However, the EUR/USD pair has broken the upper bound on the Bollinger bands which is coupled with a touch of the 70 ‘overbought’ line on RSI. Volume has been rising into the move indicating strong interest in the pair. A bearish candle to break the upper Bollinger band to the downside and a retracement from the 70 zone on RSI is required to confirm a bearish reversal.