Key Levels Being Tested At The Start Of The Trading Week
- 30 Oct 2017
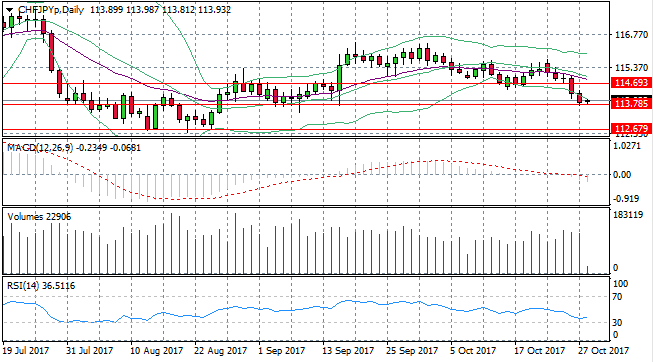
CHF/JPY
The CHF/JPY pair appears to be held up by a support area at the 113.78 price level, which represented a price low before the recent uptrend. MACD has stalled at the zero line, though appears to be breaking to the downside. In contrast, RSI appears to have bounced off the 30 support line. The 113.78 price level is significant as a break to the downside will likely send prices to the 112.67 price level.
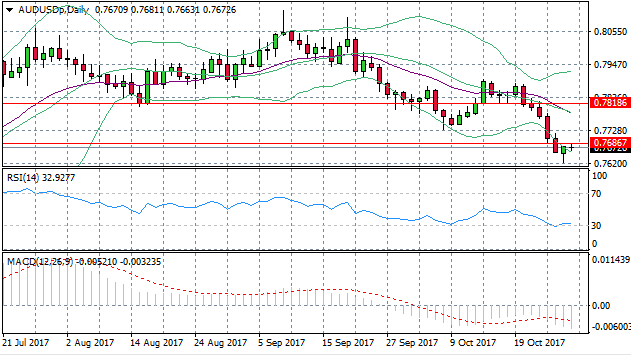
AUD/USD
The AUD/USD pair appears to be reversing a previous downtrend with a bullish candle indicating buying pressure. A break of the 0.768 price level and the lower Bollinger band has resulted in a response from buyers. RSI has also bounced off the 30 support line which is further confirmation that sentiment may be changing for the Australian dollar.
Impact event: U.S. Personal Consumption Expenditure data will be released at 14:30 GMT+2 and will impact all dollar pairs.
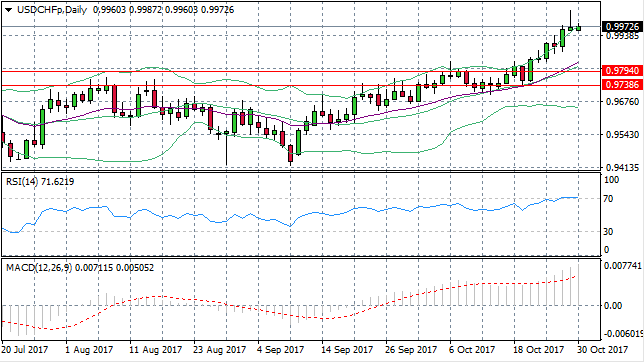
USD/CHF
A shooting star candlestick formation at the top of the uptrend after consecutive breaks of upper Bollinger band could signal a reversal for the pair. At the same time, RSI highlights the potential for a reversal in the pair despite MACD indicating momentum is bullish. A break below the upper Bollinger band and a candle closing below 70 on RSI would be required to confirm the reversal.
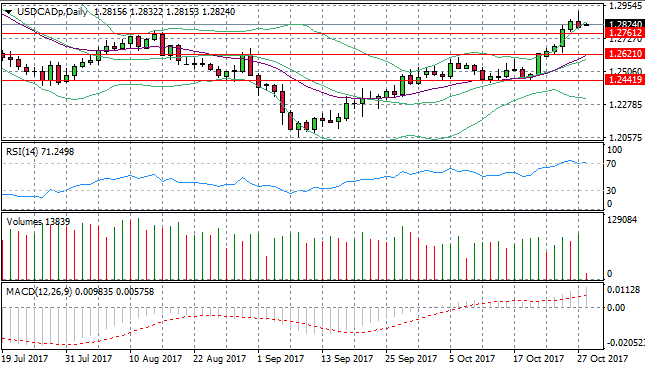
USD/CAD
Similar to the USD/CHF pair, the dollar appears to be losing its strength over the Canadian dollar with another shooting star formation at the top of the uptrend. Rising volume during the bearish move highlights sellers dominance in the previous trading session. RSI also indicates that a trend reversal may be imminent, with momentum testing the 70 overbought line.