Canadian Dollar Boosted By Oil Stock Drawdown
- 1 Sep 2017
CHF/JPY
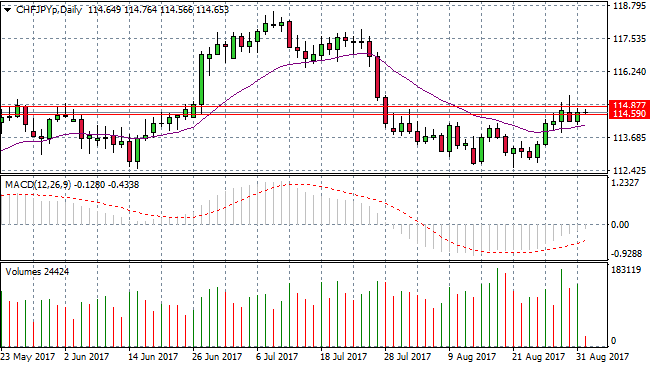
Price action for the CHF/JPY pair has broken the 20-period EMA to the upside and is now testing the 114.59 price level. Confirmation of bullish momentum has come from MACD which is close to breaking the zero line to the upside. Volume has been rising which provides further weight to the uptrend. The next price target is the 114.87 price level.
GBP/CAD
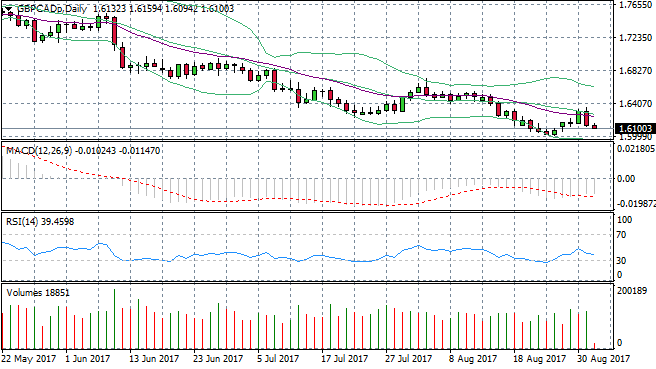
The GBP/CAD appears to be approaching a market bottom. After a break of the 20-period EMA, momentum appears to still be with the bears as highlighted by several indicators. MACD remains below the zero line, however, has flattened. RSI has a downward trajectory but is approaching the 30 oversold level. There is potential for a bullish reversal in the pair, which will be signaled by momentum indicators.
GBP/JPY
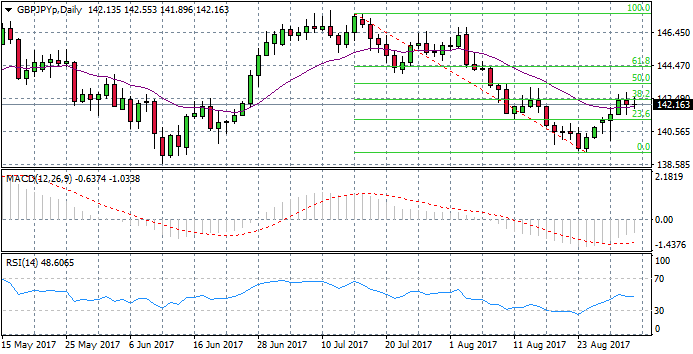
A break of the 20-period EMA on the daily chart for the GBP/JPY pair may signal the end of a bullish retracement on RSI. Price action appears to have found resistance around the 38.2 Fibo level. MACD remains below the zero line and RSI has flattened at the 50 support level. Small bodied candles indicate there is relative indecision in the market, hence the pair will more likely be influenced by fundamental factors.
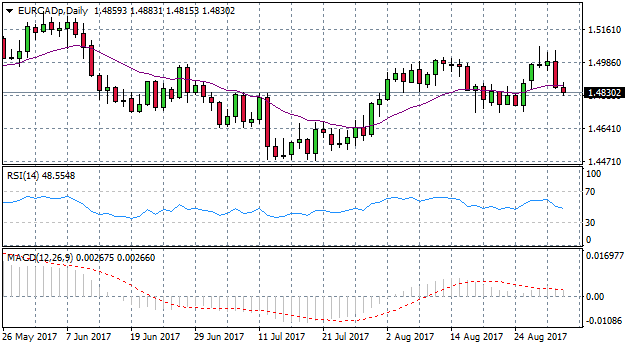
EUR/CAD
The EUR/CAD daily chart shows the pair has broken the 20-period EMA to the downside. RSI has a downward trajectory, yet MACD remains above the zero line. A break of the zero line on MACD and a full break of the 20-period EMA (a candle closing below the moving average) will be required to confirm the downtrend.